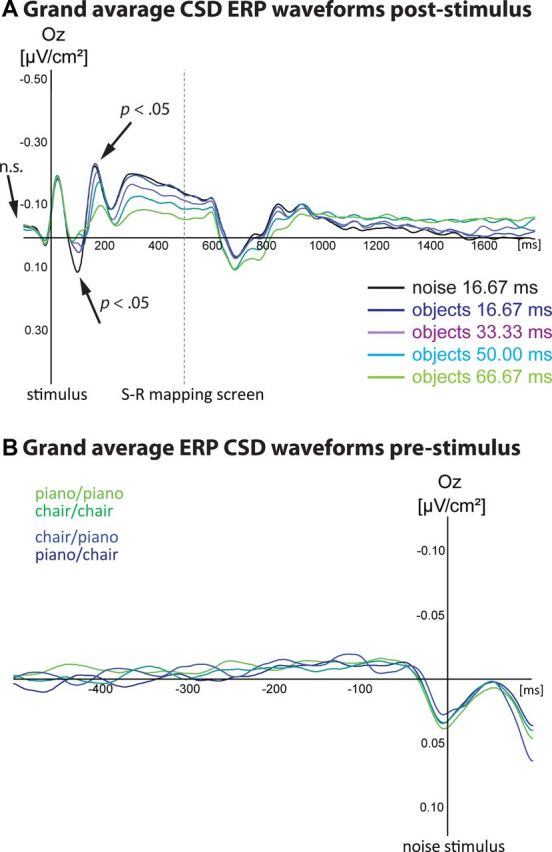
Figure 3.

Grand average CSD ERPs. A, The visual inspection of the grand average waveforms indicated strongest differences between discriminability levels at Oz electrode site in the time-periods of 50–150 (CSD-P1), 100–200, (CSD-N1), 300–450 ms (CSD-N3), and 300–600 ms (CSD-P3) (displayed for correct responses and for all pure noise trials). Significant differences between the pure noise condition and all other conditions could be found ∼100 ms poststimulus. The object discriminability conditions did not significantly differ from each other. Differences between discriminability conditions showed a first negative peak ∼200 ms. In the 66.67 ms condition, the CSD-N2 amplitude was significantly smaller compared with the 16.67 ms condition (p < 0.001), the 33.33 ms condition (p < 0.05), and the pure noise condition (p < 0.01). These differences were very pronounced during the following 500 ms. This component was smaller in the 66.67 ms condition compared with the 16.67 ms condition (p < 0.001), the 33.33 ms condition (p < 0.05), and the pure noise condition (p < 0.001). The 33.33 ms condition and the pure noise condition also differed significantly (p < 0.01). No differences between any discriminability conditions were found in the prestimulus interval. No analysis revealed any differences between pianos and chairs for any discriminability condition. 0 ms = stimulus onset; negativity is plotted upwards. B, Grant average ERP CSD waveforms at Oz electrode site preceding the onset of the following pure noise trial. ERP waveforms are displayed separately for each combination of choices (piano–piano, chair–chair, piano–chair, chair–piano). No significant differences were found, confirming that ERPs from the preceding trial were not related to choice outcomes on the following noise trials (p > 0.10). The displayed electrode site was representative for all electrode sites.
