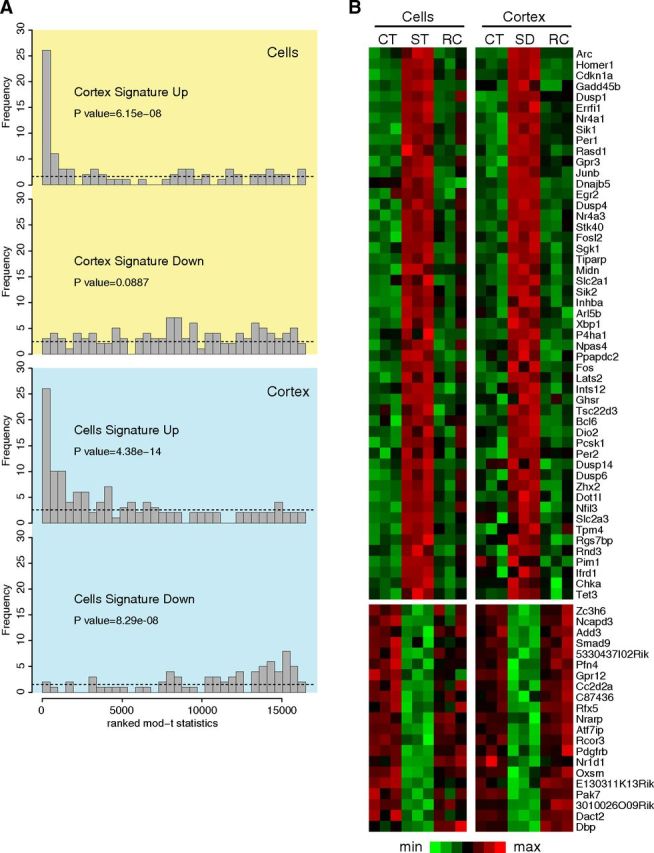
Figure 3.

Gene expression signatures in vitro and in vivo. A, Probe sets were ranked by their moderated t statistic and binned into 34 bins. The bins were ordered from the highest t statistic (left) to the lowest t statistic (right); the yellow box is from the in vitro dataset and in the blue box is from the in vivo dataset. The number of upregulated (or downregulated) probe sets from the sleep signature of the other condition dataset is displayed in each bin (the height of the bar). Under the assumption that the transcription signature of one dataset is not differentially regulated in the other dataset, probe sets from the signature should be uniformly distributed among bins, as indicated by the dashed line. The peaks on the left show that the upregulated sleep signature of one dataset tend to be upregulated in the other dataset. p values from the Mann–Whitney U test are indicated. B, Heat map with genes identified as sleep-responsive genes both in cortex and in cell cultures. Expression data were scaled (mean-centered and variance normalized) for each dataset separately. CT, Control; ST, stimulated; SD, sleep-deprived; RC, recovery. Genes are ordered by Z scores.
