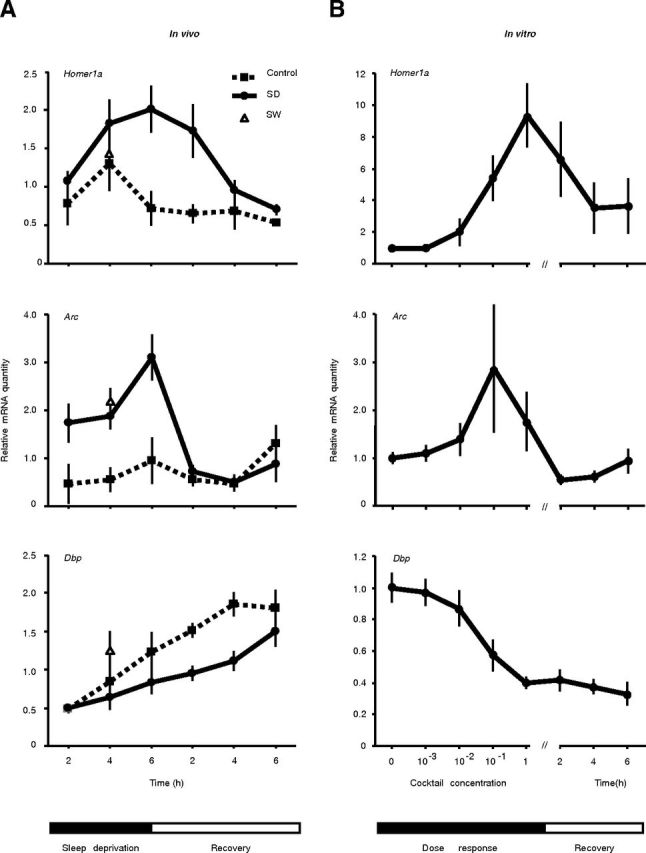
Figure 4.

Similarities in the time course of gene expression in vivo (A) and in vitro (B). The time course of gene expression was followed in vivo by sleep depriving (SD) mice (n = 4 for each time point) for 2, 4, and 6 h; 6-h-sleep-deprived mice were allowed 2, 4, or 6 h of recovery (left). Undisturbed home-cage controls were also assessed at the same time points (Control). A reference level of expression corresponding to 4 h of spontaneous wakefulness (SW) is indicated by a triangle (note that this point is 4 h into the dark period and not at the same circadian time as the 4 h of sleep deprivation after lights-on). Homer1a is overexpressed proportional to the time kept awake and decreases slowly during the recovery period, while Arc shows a rapid recovery after 6 h of sleep deprivation. Dbp is decreased by sleep deprivation and the recovery is slow. To show the similarity in the time course of gene expression, primary cortical cultures (n = 3 measured in triplicates) were stimulated at indicated concentrations of our waking cocktail; those stimulated for 3 h with 1× cocktail were allowed 2, 4, or 6 h of recovery (right).
