
Figure 6.
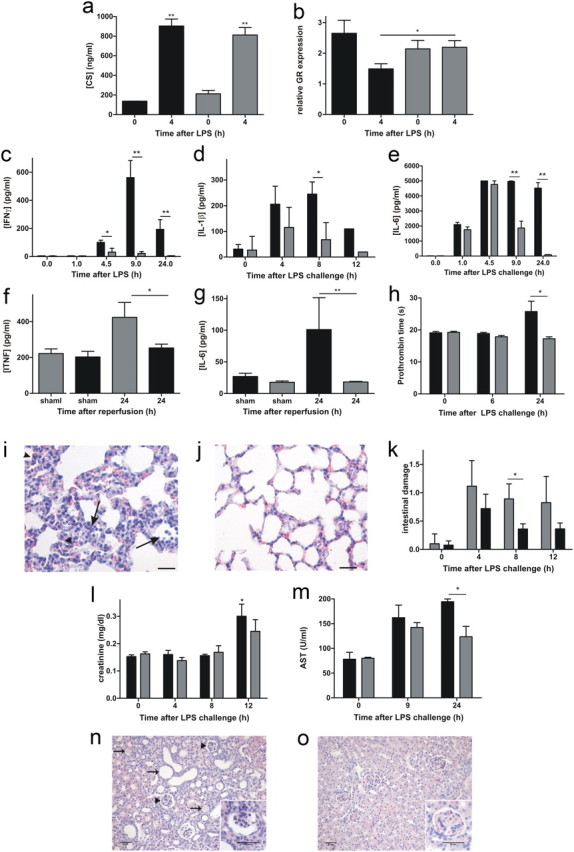
Consequences of MMP8-dependent BCSFB disruption on peripheral toxicity via HPA axis disruption and consequent MOF. a, Plasma corticosterone (CS) levels determined by RIA in MMP8−/− mice ( ) and MMP8+/+ mice (■) (0 h, n = 2–3; 4 h, n = 4). Data were analyzed with an unpaired t test. b, GR levels determined by qPCR in brain lysate of MMP8+/+ (■, n = 4) and MMP8−/− (, n = 4) mice before and 4 h after LPS challenge. Data were analyzed with an unpaired t test. Serum levels of IFNγ (c, n = 7), IL-1β (d, n = 6) and IL-6 (e, n = 6) in MMP8−/− mice () and MMP8+/+ mice (■) in function of time after a lethal intraperitoneal LPS challenge. IFNγ was determined by Cytometrix bead assay and IL-1β by BioPlex assay. Serum TNF (f) and IL-6 (g) levels in male MMP8−/− mice (, n = 5) and MMP8+/+ mice (■, n = 5) 24 h after renal I/R. Cytokines were determined by BioPlex assay. h, Prothrombin time, measured 0, 6, and 24 h after intraperitoneal LPS challenge of MMP8+/+ mice (■, n = 6) and MMP8−/− mice (, n = 6). Data are expressed as percentage of normal based on a standard curve of normal pooled plasma. i, j, Histopathology (hematoxylin and eosin staining) of lung sections of MMP8+/+ (i) and MMP8−/− (j) mice, 12 h after LPS. LPS-induced lung injury was characterized by influx of inflammatory cells (arrows) and thickening of the alveolar wall and atelectasis (heads). k, Quantification of intestinal tissue damage in MMP8+/+ (■) and MMP8−/− () mice: four neutral observers evaluated hematoxylin and eosin stained sections (n = 3–5) in a blinded setup. LPS-induced intestinal damage is characterized by decreased villus height, disappearance of the mucus layer and Goblet cells along the villus, cell death at the villus top, and cell debris in the lumen. l, Creatinine accumulation in circulation of MMP8+/+ mice (■) and MMP8−/− mice () 0, 4, 8, and 12 h after LPS challenge (n = 4–5). m, AST levels in circulation of MMP8+/+ mice (■) and MMP8−/− mice () (n = 3–5). Data were analyzed with an unpaired t test. n, o, Histopathology (hematoxylin and eosin staining) of kidney sections of female MMP8+/+ mice (n) and MMP8−/− mice (o) 12 d after the induction of sublethal kidney I/R. Recovery from renal injury is shown by the presence of dilated tubuli (arrows), and hyperfiltration is shown by widening of the urinary space of Bowman's capsule and the increased number of mesenchymal cells in the glomeruli (heads and insert). Scale bar, 50 μm.