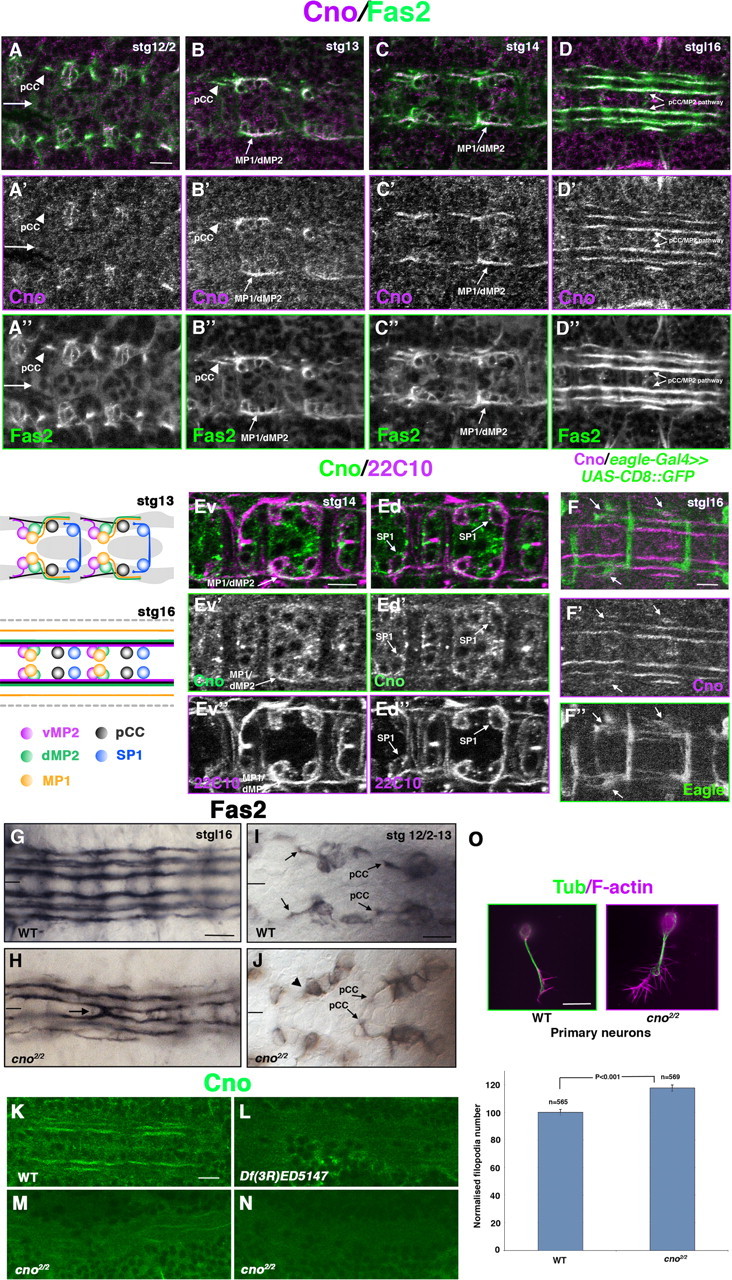
Figure 1.

Cno is expressed along pioneer ipsilateral axons and is required during axon pathfinding. A–D”, Ventral views of Drosophila embryos stained with Cno (magenta) and Fas2 (green) throughout neuronal differentiation. Cno colocalizes with Fas2 in ipsilateral pioneer neurons since early stages (stg 12/2). Arrows (A–A”) point to the midline. Cno is strongly detected in Fas2-positive axons, which include the ipsilateral pCC (A–B”, arrowheads) and MP1/dMP2 neurons (B–C”, arrows). Later, during stage 16, Cno is still detected along Fas2-positive longitudinal tracts, including the most medial pCC/MP2 pathway (D–D”, arrows). The schematic drawing represents the position of the indicated subset of neurons at stages 13 and 16. Ev–Ed”, Two different focal planes of the ventral cord, more ventral (v) and more dorsal (d) of a stage 14 Drosophila embryo stained with Cno (green) and 22C10 (magenta). In a ventral view (Ev–Ev”), Cno is detected along with 22C10 in the ipsilateral MP1/dMP2 neurons (arrows). In a more dorsal view (Ed–Ed”), low levels of Cno are present in the cell body of the SP1 contralateral neurons (arrows). F–F”, At late stage 16, Cno is observed in contralateral Eagle+ axons that have already crossed the midline (arrows). G–H, In WT late stage 16 embryos, Fas2 is expressed in three longitudinal fascicles at each side of the midline (G). In cno2/2 mutants, Fas2-positive axons cross the midline (H, arrow; see also Fig. 2G). I, J, At early stages (12/2–13), guidance defects in Fas2-positive pioneer neurons, such as pCC (arrows), are already detected in cno2/2 mutants. Defects in axon outgrowth are also observed (J, arrowhead). K–N, In WT embryos, Cno is clearly detected in longitudinal axon bundles (K), whereas this expression steeply drops or disappears in Df(3R)ED5147 (L) and cno2/2 (M, N) homozygous mutant embryos. O, In cno2/2 primary neuron cultures, the number of filopodia per neuron was significantly increased compared with WT neurons (n = number of neurons analyzed). Tubulin (Tub) is in green and F-actin (Phalloidin) is in magenta. Scale bars: A–N, 10 μm; O, 5 μm.
