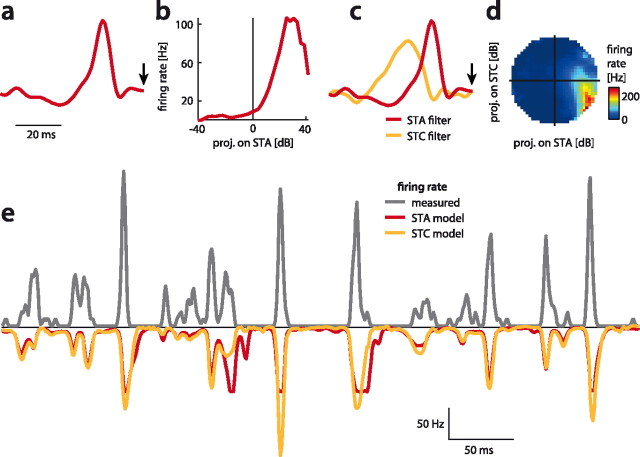
Figure 2.
Structure of the STA and STC model for an ascending neuron AN1. a, STA filter. The arrowhead marks the time of occurrence of the spike. b, Nonlinearity relating the projection values of each stimulus onto the STA to the cell's firing rate. c, STA filter (red) and the filter obtained by STC (orange). d, 2D nonlinearity relating the projection values of stimuli onto the STA (x-axis) and STC filter (y-axis) to the cell's firing rate. Firing rate is color coded (see color bar). Note that this neuron responds only to a small subset of projection values. e, Measured response (black) and the predictions from the STA (red) and STC model (orange) were highly similar.

