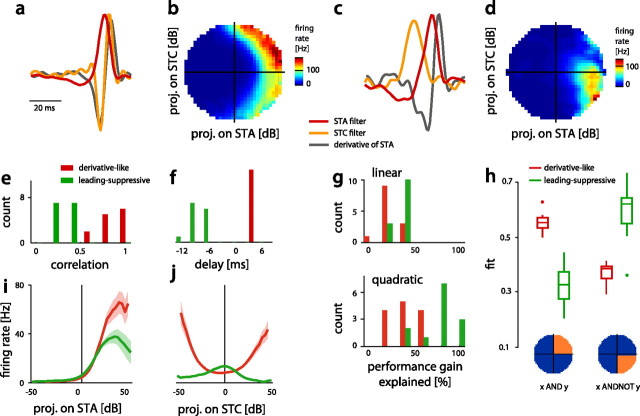
Figure 4.
Filters and nonlinearities of both classes of cells. a, c, Filters of a derivative-like, tonic subtype of BSN1 (BSN1t) (a) and a leading-suppressive AN3 (c; STA, red; STC, orange; derivative of STA, gray). The STC filter of the cell in a resembled the negative derivative of the STA filter. The STC filter in c did not look like the negative derivative of the STA filter; however, it led the STA filter. b, d, Nonlinearities for the cells in a and c. Firing rate is color coded (see color bars right to each nonlinearity). e, Correlation coefficient between the STC filter and the negative derivative of the STA filter (derivative-like: 0.83 ± 0.11, leading-suppressive: 0.31 ± 0.08, p = 2 · 10−11, rank sum). Red indicates derivative-like, green leading-suppressive cells in subfigures (e–j). f, Delay between the peaks of the STA and the STC filter, taking the STA as a reference (derivative-like: 3.0 ± 0.6 ms, leading-suppressive: −7.8 ± 1.9 ms, p = 4 · 10−6, rank sum). g, Ability of minimal linear (top) and quadratic (bottom) models to explain the performance gain of the STC model relative to the STA model. h, Ability of two different canonical logical operators to explain the structure of empirical 2D nonlinearities. Template nonlinearities corresponding to an AND and AND-NOT like integration of the STA and STC filter are shown below. i, j, Nonlinearities for the STA and STC filter of both classes of cells (thick lines and shaded area indicate mean ± SEM over all cells in a class).

