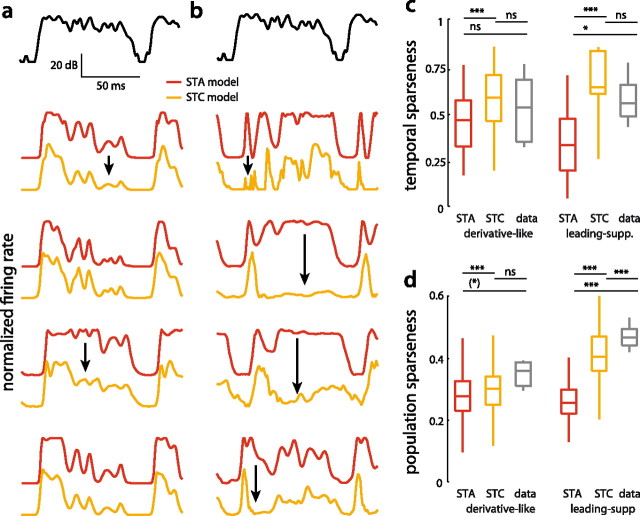
Figure 5.
Sparseness of model responses to natural communication signals. a, b, Section of the envelope of a grasshopper song (top). Responses of STA (red) and STC models (orange) of four different specimen of derivative-like (a) and leading-suppressive cells (b). Firing rates were normalized by their maximum for plotting purposes. Black arrows indicate epochs were the response patterns of STA and STC models differed strongly. c, d, Temporal (c) and population sparseness (d) of STA and STC models of both classes. Sparseness values quantified from neural recordings in response to natural songs are shown in gray. ***p < 0.001, *p < 0.5, (*) p = 0.06, n.s. p ≫ 0.05. Note that p values in the comparison between STA and STC values came from paired tests (sign rank), while the comparison of the STA or STC models and the data was unpaired (rank sum). Hence, the differences between STA and STC models are highly significant despite substantial overlap of the distributions.

