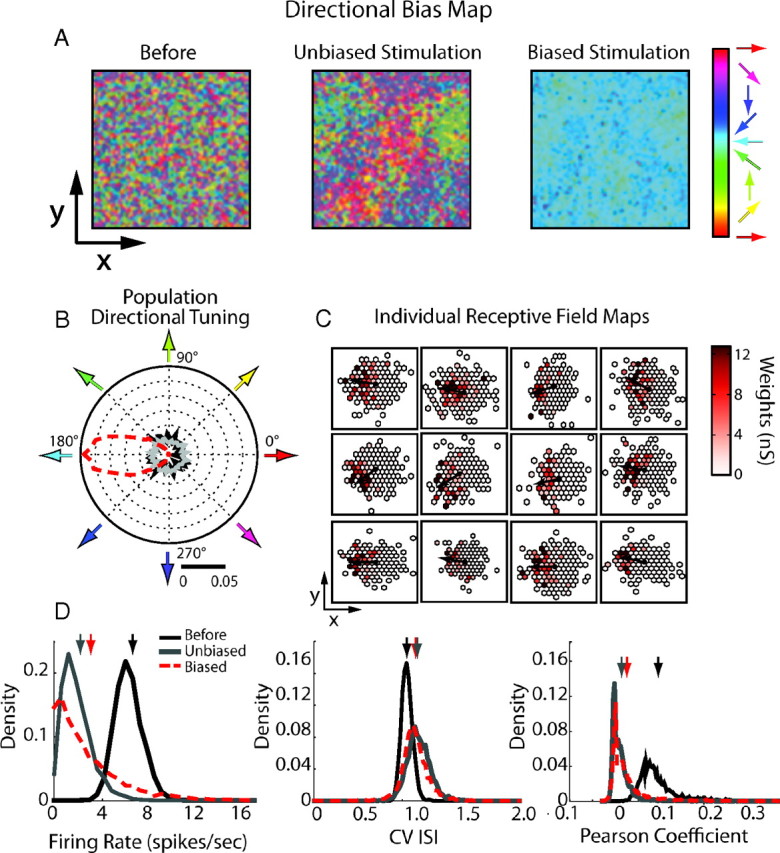
Figure 11.

Stable learning in recurrent retinotopically organized networks stimulated with moving bars. A, Maps of direction preferences, color coded and computed for each neuron in the network from their individual receptive fields. For one neuron, the receptive field corresponds to the spatial distribution of its synaptic sources (locations of the presynaptic neurons afferent to the same target cell). Individual direction preferences were computed by identifying the direction, in each receptive field, in which recurrent presynaptic weights were the strongest (see Materials and Methods). The left shows the map of the direction preferences in the initial, randomly connected network under spontaneous activity. Middle and right shows these maps induced by plasticity respectively after unbiased (middle) or directionally biased (right, red arrow) conditioning stimulations. B, Distribution of the direction preferences gathered across all neurons during spontaneous (black curve), directionally unbiased (gray curve), and biased conditioning (red dashed curve) stimulation. The direction tunings are measured from individual receptive fields as spatial biases in the recruitment of presynaptic sources. C, Examples of individual receptive fields for several neurons randomly selected in the network after the biased stimulation. The maps are centered on the reference postsynaptic neurons (black dots), and individual direction preferences are indicated by black arrows. Incoming synaptic weights are color coded. D, Network firing statistics before stimulation and after the different stimulation phases: left, firing rate distribution; middle, ISI CV; right, mean Pearson's coefficient computed over 2000 distinct neuron pairs. Arrows indicate mean values for each phase.
