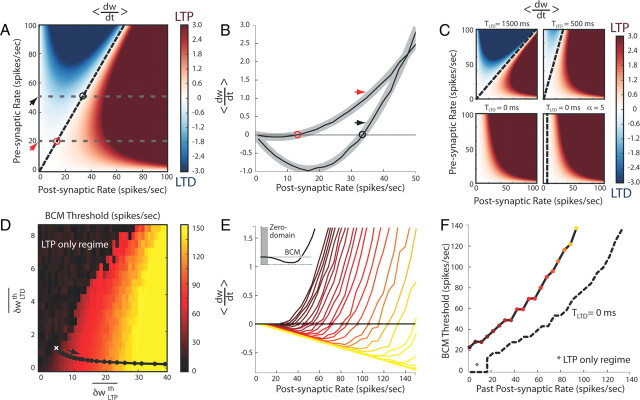
Figure 4.
Relationship between mSTDP and the BCM plasticity rule. A, Mean synaptic change 〈dw/dt〉 (LTP in red, LTD in blue) as a function of presynaptic and postsynaptic firing rates in a two-neuron model with Poisson-process firing statistics and in the absence of slow variables. The oblique dotted line represents the crossing point of the plasticity curve between LTD and LTP. B, Two BCM-like plasticity curves, linking synaptic change with mean postsynaptic activity, correspond to the gray dashed lines in A, respectively, for a presynaptic firing rate of 20 spikes/s (red arrow) and 50 spikes/s (black arrow), with the LTD–LTP transition threshold marked by an open circle. Theoretical predictions are shown in bold gray. C, Same as in A for different TLTD and α values. Note that α has been set to 0.46 in the first three panels and α = 5.00 in the last panel. D, Values of the LTD–LTP transition threshold (BCM) are plotted as a function of asymptotic (constant) slow variables δwLTPth and δwLTDth, corresponding to an infinite T. The black curve represents a trajectory obtained for a presynaptic firing rate of 10 spikes/s and different postsynaptic firing rates when T = 10 s and for (αLTP,αLTD) = (5, 1.15). E, BCM-like plasticity curves obtained along the black trajectory with the same color code as in D. In the inset, a representative curve depicting the singularity around the floating threshold (BCM) and the zero domain of stability at the origin. F, Supralinear dependence of the floating plasticity threshold on the past postsynaptic firing rate history corresponding to the curves shown in E. In dashed black, the same curve when TLTD = 0 ms. The input rate-dependent region in which only LTP can occur is indicated by an asterisk.

