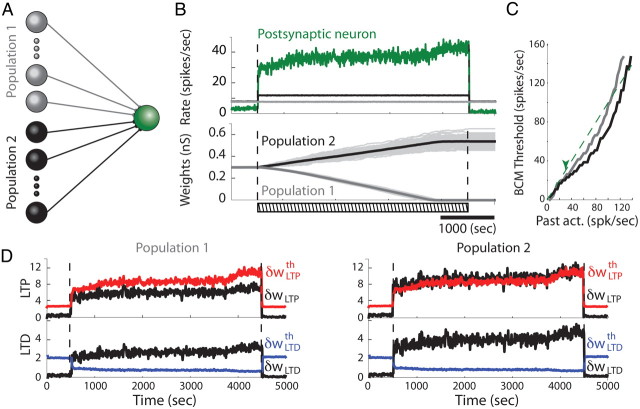
Figure 5.
Firing rate-based competition produced by mSTDP. A, Illustration of the feedforward model (only excitatory cells are shown). B, Time evolution of firing rates (top) and synaptic weights (bottom) in a feedforward model with presynaptic Poisson processes. In this protocol, the postsynaptic neuron receives Poisson input from two presynaptic populations. After 500 s, presynaptic neurons in population 2 double their firing rates from 8 to 16 spikes/s (black curve), whereas the other population remains unchanged (gray curve). The firing rate of the postsynaptic neuron is shown in green. The bottom plot represents individual synaptic weights in light gray, as well as the mean weight of population 1 in dark gray and population 2 in black. After 4000 s, the firing rate of population 2 is relaxed to its initial value. The dashed bar indicates the onset, offset, and duration of the stimulation. C, Floating plasticity threshold dependence on the past postsynaptic firing rate for both populations. The green arrow indicates the stable postsynaptic firing rate during the competitive learning protocol, before population 1 weights reach their lower bound at 0. The dashed green line indicates identity. D, Time evolution of the fast variables δwLTP and δwLTD (black curves), as well as the corresponding slow variables δwLTPth (red) and δwLTDth (blue).

