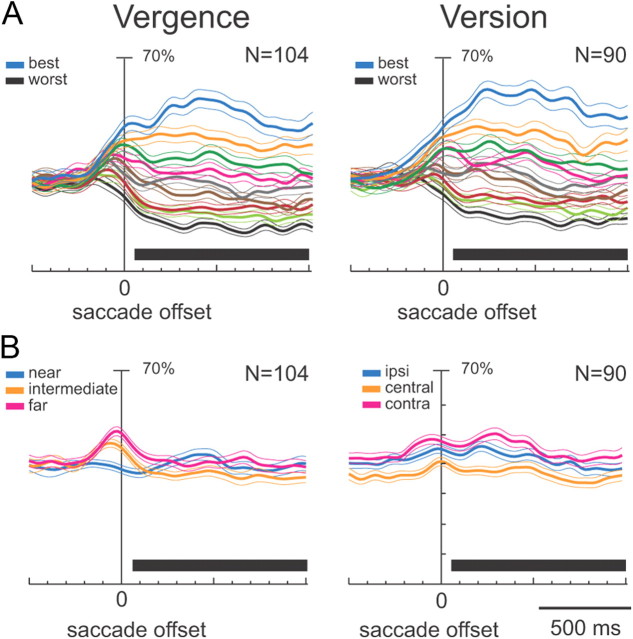
Figure 7.
Population activity of V6A neurons modulated during FIX. A, Population average normalized SDFs were constructed by ranking the response of each neuron for each fixation position in descending order according to the intensity of the discharge during FIX. B, SDFs were constructed by ranking the response for each tested row of fixation targets. The thick lines indicate average normalized SDF; the light lines indicate variability bands (SEM). Activity is aligned with the offset of the saccade. The black rectangles below each plot indicate the periods where the permutation test was run. Most responses in plots A are statistically different one from the other (permutation test, p < 0.05), indicating that V6A neurons are able to discriminate the different fixation positions both in vergence and in version. In plot B (left), no statistical differences were observed between the curves (permutation test, p > 0.05), in B (right), the central row is statistically different from the other two (permutation test, p < 0.05). The few significant differences in permutation tests in B indicated that there is no clear spatial preference as a whole. Scale on abscissa: 100 ms/division; vertical scale: 70% of normalized activity (10% per division).

