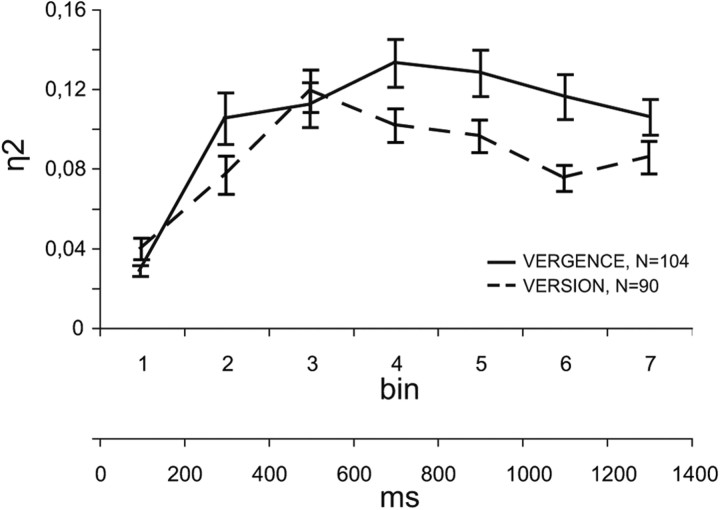
Figure 9.
Time course of version and vergence selectivity. Temporal profiles of the magnitude of firing selectivity calculated for the population of neurons modulated by vergence or version during FIX (104 cells for vergence only or vergence and version, solid line; 90 cells for version only or version and vergence, dashed line). Selectivity was calculated as the η2 index (see Materials and Methods), while variability bars are SEM. Selectivity raised after the beginning of fixation (bin 3) until a maximum and then remained high until the LED change for the entire duration of fixation, even if the decay of version selectivity after fixation onset was more remarkable than the vergence one.

