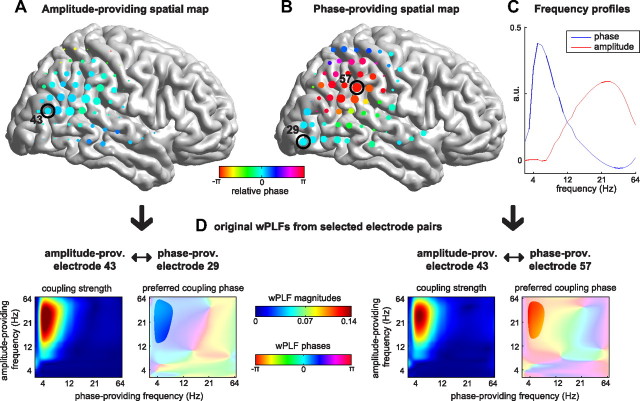
Figure 5.
N-way decomposition reveals the spatial distribution in PAC in sets of two spatial maps and two frequency profiles. Each 4-way array of wPLFs from each dataset was decomposed into one or more components, each component being a set of two spatial maps and two frequency profiles. The diversity in the preferred coupling phase is explained by the two complex-valued spatial maps, namely by their phase diversity across space. A–C, Example component from a representative subject. A, Amplitude-providing spatial map. B, Phase-providing spatial map. Both the amplitude- and phase-providing spatial map are widely distributed over the cortex, but the phase-providing spatial map is wider and shows more phase diversity. The size of the markers indicates the contribution of each electrode to the spatial map, and the color indicates the relative phase of the electrodes. C, Amplitude- and phase-providing frequency profiles. These profiles show that the example component involves a coupling between the phase of a theta oscillation and the amplitude of a beta/gamma oscillation. D, wPLFs (for all frequency pairs) of two selected electrode pairs. The frequency pairs for which there is strong coupling closely match the frequency profiles in C, and the difference between the preferred coupling phases closely match the corresponding phase difference in the phase-providing spatial map.

