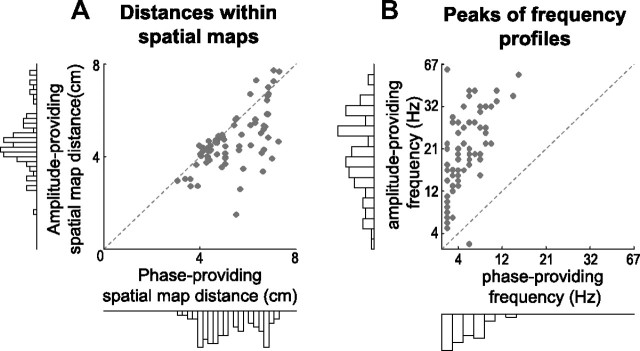
Figure 6.
Spatial extent of spatial maps and frequency profiles. A, Mean distance within components in phase-providing spatial maps (horizontal axis) plotted against the mean distance in amplitude-providing spatial maps (vertical axis). The mean distance within components was on average higher for the phase-providing than for the amplitude-providing spatial maps (paired samples t test; t(84) = −5.56, p < 1e-6). B, Scatter plot of the peaks of the phase-providing frequencies (horizontal axis) versus the peaks of the amplitude-providing frequencies (vertical axis). There is a substantial spread of the peaks of the phase-providing frequency profiles, ranging from delta to alpha, and those of the amplitude-providing frequency profiles, ranging from theta to gamma. Note the difference with respect to Figure 3D, and see Results for a possible explanation. For selection of electrodes, see Materials and Methods.

