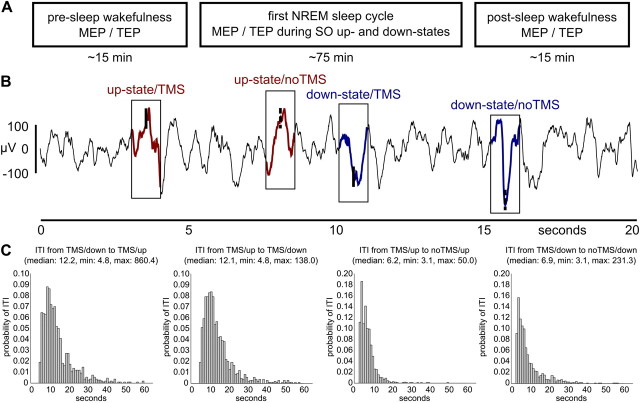
Figure 1.
Experimental time line and example data. A, MEPs (EMG at the contralateral hand) and TEPs (64-channel EEG) were acquired for SO up- and down-states during first NREM sleep cycle as well as during pre-sleep and post-sleep wakefulness. B, An adaptive thresholding algorithm automatically detected up- and down-states of the slow oscillation during NREM sleep. TMS was triggered by every second event (TMS), whereas the others were left unstimulated as a baseline (noTMS). An example EEG data strip (channel C3) is shown containing all four event types. C, Histograms show relative frequencies (1 s bins) of the relevant intertrial intervals (ITI), and the corresponding descriptive statistics. Note that the few delays lasting even longer than 60 s are not included in the histograms for the sake of visibility. min, Minimum; max, maximum.

