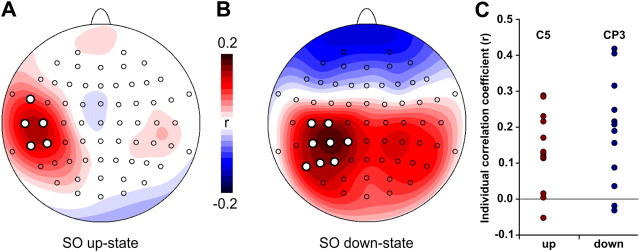
Figure 3.
A, B, Single-trial correlations between SO amplitude (directly before TMS) and MEP amplitude (log transformed) for SO up-states (A) and SO down-states (B). MEP amplitude depended on the current EEG potential in the left sensorimotor cortex. The more depolarized the larger the MEP (up-state) and the more hyperpolarized, the smaller the MEP (down-state). Colors represent group-averaged correlation coefficients ranging from 0.2 (red) to −0.2 (blue) for each electrode. White dots indicate correlations significant at pcorr < 0.05. C, Individual correlation coefficients for peak electrodes C5 (up-state) and CP3 (down-state).

