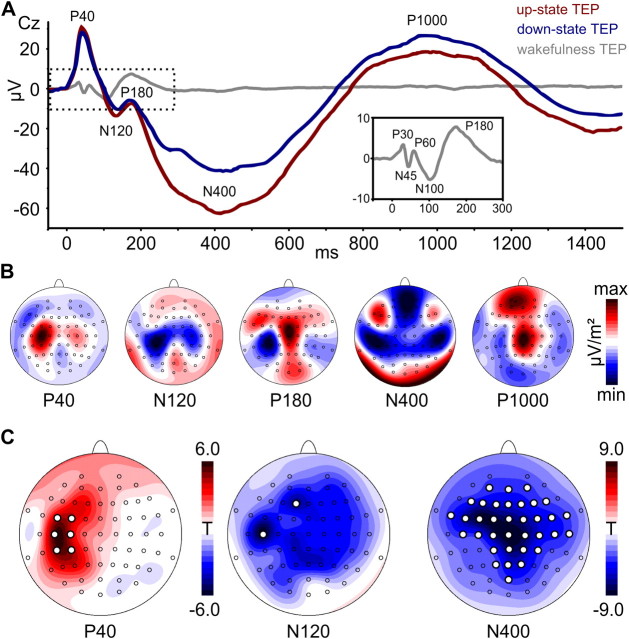
Figure 5.
TMS-evoked potentials. A, Group-averaged TEPs in representative channel Cz for TMS stimulation during SO up-states (red), SO down-states (blue), and wakefulness (gray). The wake TEP is shown for visual comparison with the inset depicting an enlarged version of the dotted area for better visibility (averaged across pre-sleep and post-sleep measures). TEP components are labeled according to their polarity and approximate latency. Note the striking difference between the SO-like sleep TEPs and the typical high-frequency wake TEP. B, Scalp current source density (CSD) maps for the most pronounced sleep TEP components (averaged across SO states; high-pass filtered for P40, N120, and P180). Maps are scaled individually according to their respective minimum (blue) and maximum (red) CSD values (μV/m2). C, Statistical maps depict color-coded t values from electrode-wise amplitude comparisons (SO up-state minus down-state) of individual TEP components. White dots indicate differences significant at pcorr < 0.05 (no significant channels were revealed for P180 and P1000). See Materials and Methods for details.

