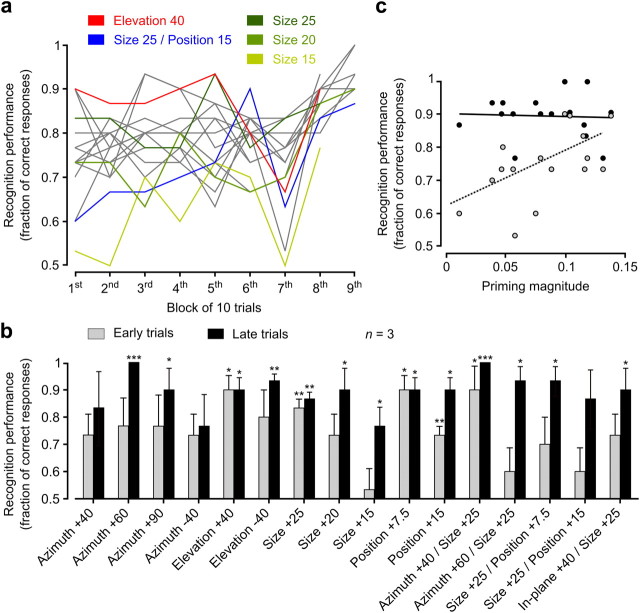
Figure 8.
Relationship between priming magnitude and recognition performance. a, Group average performance of three rats (of the 5 animals originally included in the group analysis) at recognizing the prototype appearances that had been used as primes in the priming experiment. The plot shows the trend of the performances as a function of the number of trials performed by the animals (performances were computed in consecutive blocks of 10 trials). Colors highlight the performances obtained for five example prototype appearances. b, Bars show rats' group average recognition performance obtained in early trials (i.e., the first block of 10 trials; gray) and late trials (i.e., either the eighth or ninth block of 10 trials, depending on the tested prototype appearance; black). The asterisks indicate whether the performances were significantly above chance according to a one-tailed unpaired t test (*p < 0.05; **p < 0.01; ***p < 0.001). c, Relationship between rats' recognition performance and priming magnitude (i.e., the group average variation in the fraction of 100% morph responses shown in Fig. 5c, but including only the three rats that entered in the calculation of the group average performances) in early (gray circles) and late (black circles) trials (data refer to all 16 tested appearances of the object prototypes). In cases in which a black and gray circle overlapped, they were slightly displaced to make both of them visible. Performance and priming magnitude were significantly correlated in early trials (r = 0.58; p = 0.02, two-tailed t test) but not in late trials (r = −0.05; p = 0.86, two-tailed t test). Error bars indicate SEM.

