
Figure 3.
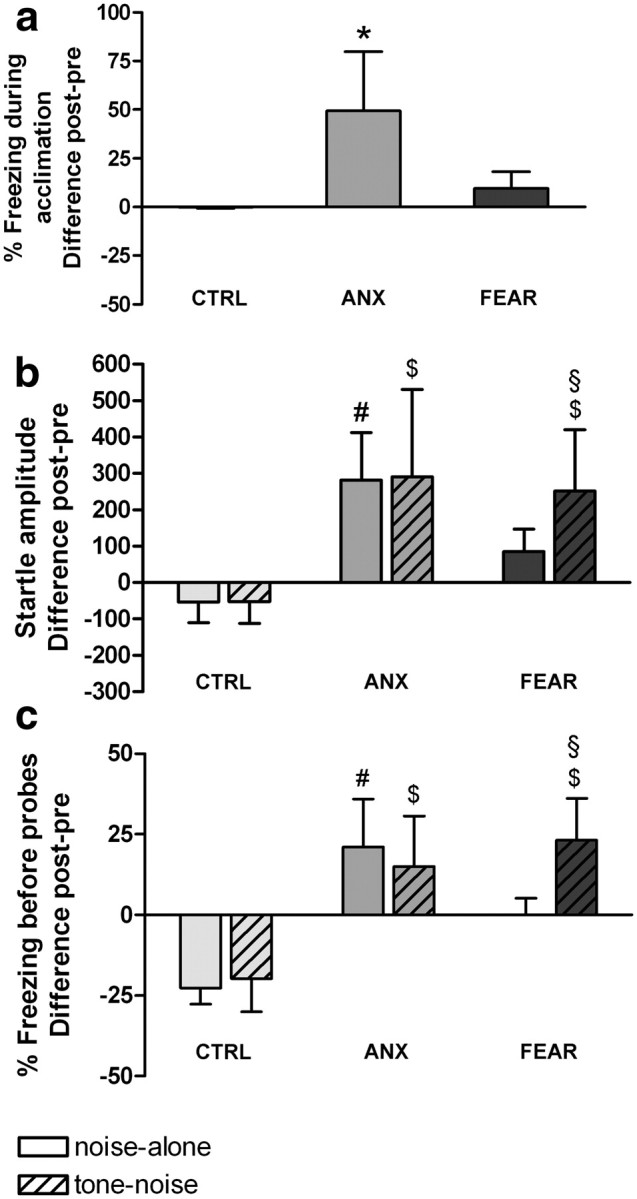
Effects of conditioning on percentage freezing during acclimation (a), startle amplitude (b), and percentage freezing during 10 s before startle probes (c). Difference scores of posttest minus pretest of subgroups are shown (means ± SD) (n = 5 per subgroup). *Significantly higher than CTRL and FEAR. #Significantly higher than CTRL noise-alone. $Significantly higher than CTRL tone–noise (ANOVA with Tukey's post hoc tests, p < 0.05). §Significantly higher than FEAR noise-alone (planned comparisons with Bonferroni's correction for multiple testing, p < 0.017).