
Figure 4.
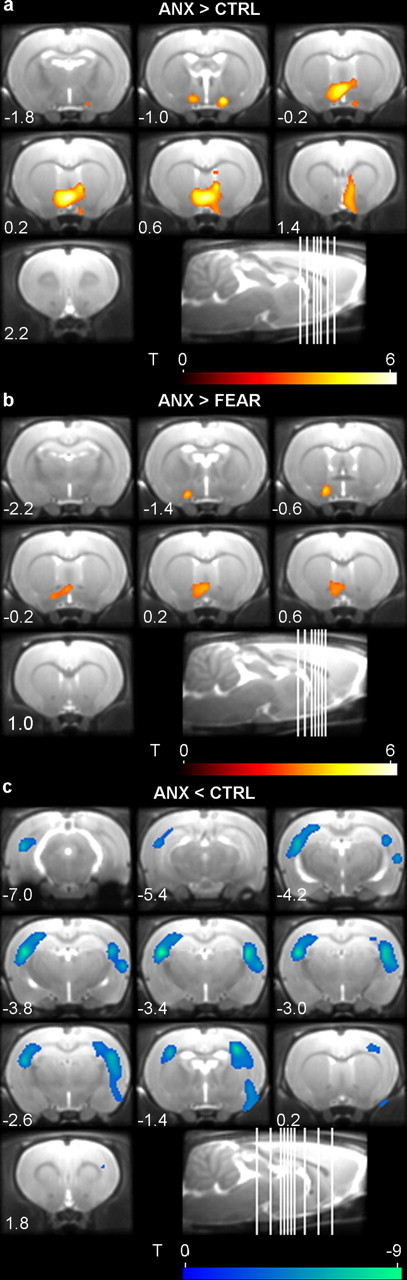
Mean coronal MR images of the brain showing functional microPET overlays of the clusters comprising the bed nucleus of the stria terminalis (a, b) and of the cluster covering the somatosensory cortex (c). Relative brain metabolism is increased (red) or decreased (blue) when comparing a subset of the ANX, FEAR, and CTRL groups (n = 5 per subgroup) (comparison is stated on figure). Clusters are shown using a T statistic color scale, which corresponds to the level of significance at the voxel level. The distance (in millimeters) relative to bregma of each section is indicated (positive values for sections anterior to bregma), as well as a sagittal view of the rat brain with depiction of the coronal slice location. Images are displayed in neurological convention, with the left side corresponding to the left hemisphere.