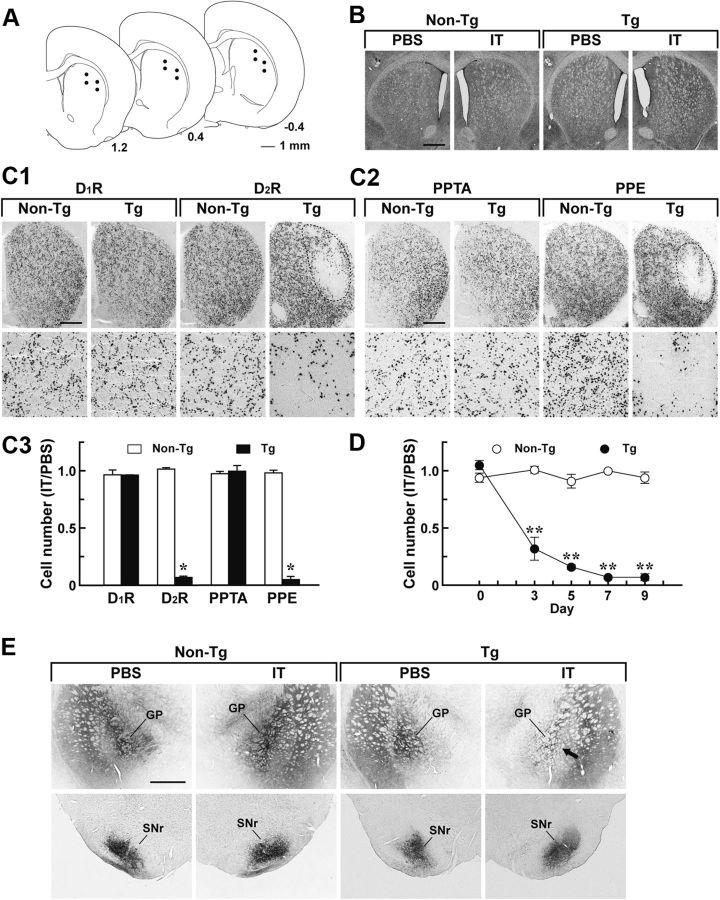
Figure 2.
Selective targeting of the striatopallidal pathway arising from the DLS. Rats were unilaterally injected with IT or PBS into their DLS and processed for histological analysis. A, Schematic illustration of coordinates for the injection. The anteroposterior coordinates (millimeters) from bregma are shown. B, Cresyl violet staining of sections through the striatum prepared from the rats 7 d after the injection. C, In situ hybridization analysis of medium spiny neurons. Sections were hybridized with labeled riboprobe for a rat D1R or D2R sequence (C1) or for a rat PPTA or PPE sequence (C2). Top, light microscopic images of the dorsal striatum on the IT-injected side. Bottom, magnified views of the DLS region. Cell counts of in situ hybridization images are also shown (C3). The ratio of cell number on the IT-injected side relative to that on the PBS-injected side was calculated. n = 4 for each group. *p < 0.001, significant differences from the non-Tg rats (Student's t test). D, Time course of neuron elimination. Striatal sections were prepared from the rats on different days after the injection and stained by in situ hybridization with the D2R probe. The ratio of cell number on the IT-injected side relative to that on the PBS-injected side is plotted. n = 4 for each group. **p < 0.01, compared with the non-Tg group, LSD test. E, Anterograde axonal tracing. Rats were injected bilaterally with BDA solution into their DLS and then used for unilateral treatment with IT or PBS. Sections through the GP and SNr were stained for BDA signals. The arrow indicates the reduced density of striatopallidal nerve terminals on the IT-injected side of the Tg rats. Scale bars: A, 1 mm; B, C, E, 500 μm.

