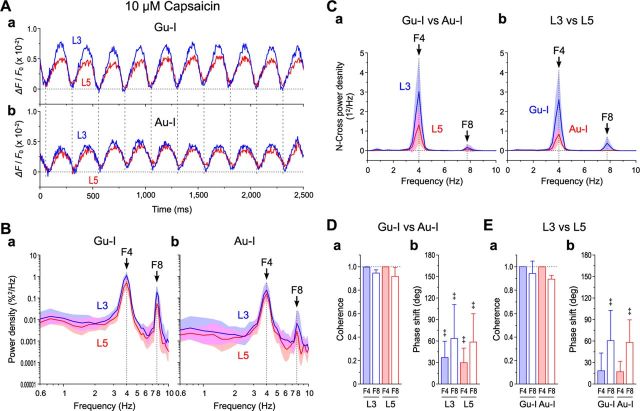
Figure 8.
Theta synchronization between Gu-I and Au-I. A, Examples of temporal profiles of long-lasting oscillatory optical responses triggered by 6 μA (=1.8 × Th*) Gu-I L4 stimulation in the presence of 5 μm capsaicin. Temporal profiles at ROIs located in L3 (blue traces) and L5 (red traces) of Gu-I (a) and those of Au-I (b) were simultaneously obtained. The vertical dotted lines indicate the timing of negative peaks of Gu-I L3 responses (250 ms interval). B, Geometric mean (× [geometric SD]±1) power densities of the oscillatory responses in L3 (blue curves) and L5 (red curves) of Gu-I (a) and those of Au-I (b) (n = 5). C, Mean (±SD) cross-power densities between Gu-I and Au-I in L3 (blue curve) and L5 (red curve) (a) and those between L3 and L5 in Gu-I (blue curve) and Au-I (red curve) (b) (n = 5). D, E, Mean (±SD) values of coherence (a) and phase shift (b) between F4 and F8 components of Gu-I and those of Au-I (D) and between those of L3 and those of L5 (E) (n = 5). ‡p < 0.05 (vs 0°). Coherence between Gu-I and Au-I: L3 F4, 0.998 ± 0.003; L3 F8, 0.946 ± 0.026; L5 F4, 0.998 ± 0.001; L5 F8, 0.916 ± 0.078. Coherence between L3 and L5: Gu-I F4, 0.999 ± 0.001; Gu-I F8, 0.941 ± 0.107; Au-I F4, 0.998 ± 0.002; Au-I F8, 0.894 ± 0.032. Phase shift between Gu-I and Au-I: L3 F4, 37 ± 23°; L3 F8, 64 ± 47°; L5 F4, 30 ± 20°; L5 F8, 59 ± 39°. Phase shift between L3 and L5: Gu-I F4, 19 ± 25°; Gu-I F8, 61 ± 42°; Au-I F4, 17 ± 14°; Au-I F8, 58 ± 32°.

