
Figure 1.
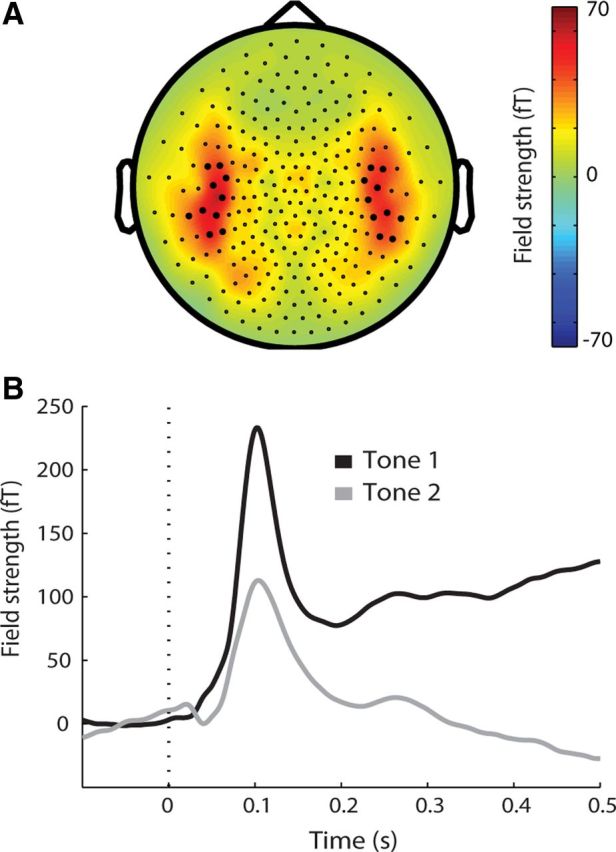
Localization of auditory activation. A, Topographic representation of average MEG channel activation for all tones in the 50–150 ms interval after tone onset (dashed line). The 10 maximally activated channels in each hemisphere are highlighted. B, Average auditory evoked field for all tones in selected channels highlighted in A. The two tones occurred in succession, but are displayed in the same time window here to highlight neuronal suppression for the second tone.