
Figure 3.
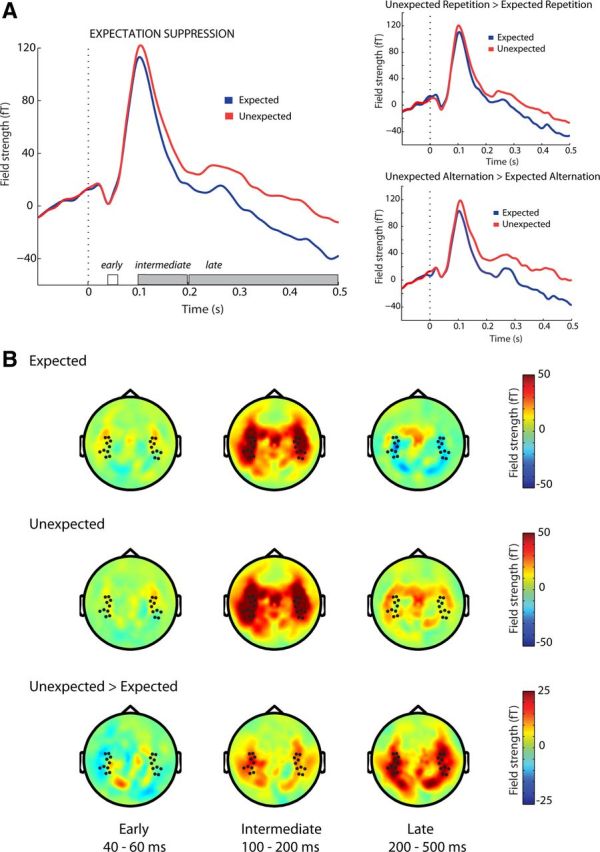
Effect of pitch expectation on neuronal suppression. A, Auditory evoked fields for expected (blue) and unexpected (red) tones. Temporal windows are denoted on the x-axis. Significant effects are in gray. Dashed line represents tone onset. B, Average topography over time for expected tones (top), unexpected tones (middle), and their difference (bottom). Dots represent analyzed channels.