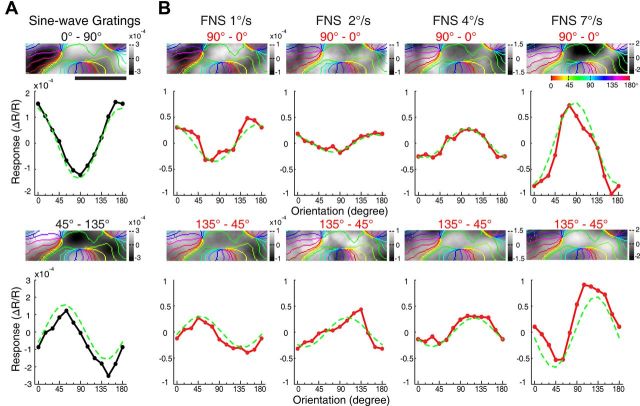
Figure 9.
Motion-axis domains within a thick stripe in V2, from the left hemisphere of macaque M06275. A, Differential orientation maps produced by sine-wave gratings (0–90° and 45–135°) from ROI 2 in Figure 8, a region that showed robust direction-selective responses. The corresponding orientation response profiles are shown underneath each differential map. B, Differential motion-axis maps generated by FNS drifted at different speeds. The results of response profile analysis at each speed are shown underneath each motion-axis map. Note that when the FNS moving speed exceeded 2°/s, the population response profiles inverted in comparison with those generated by gratings and FNS with moving speed of 1°/s. Scale bar, 1 mm.

