Figure 2.

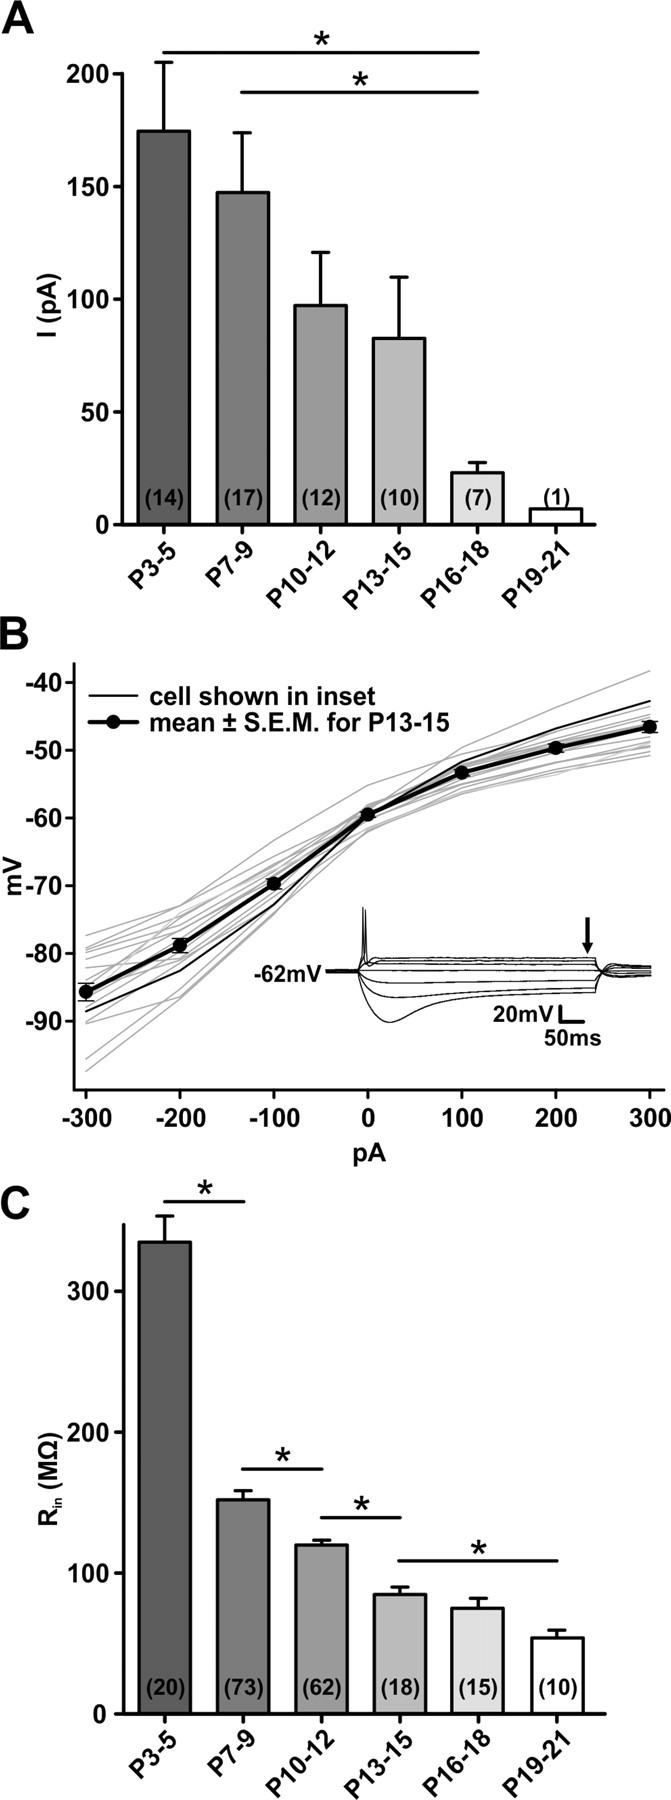
P2XR current decreases with maturity. A, Mean peak currents evoked by ATPγS in SBCs of different postnatal ages. Current amplitudes gradually decrease to P15, after which a marked reduction is observed. B, Plots of voltage as a function of injected current for 18 SBCs from P13–P15. Inset shows responses of the SBC depicted by the thin black line in the graph. The steady-state voltage was determined at the point shown by the arrow and plotted in the graph. The slope of these plots at the resting membrane potential is the input resistance, on average 84.8 ± 3.7 MΩ (n = 18). C, Developmental change of input resistance of SBCs. The most notable change occurs between P3–P5 and P7–P9. Error bars indicate mean ± SEM. Cell numbers are given in parentheses. *p < 0.05.
