Figure 1.
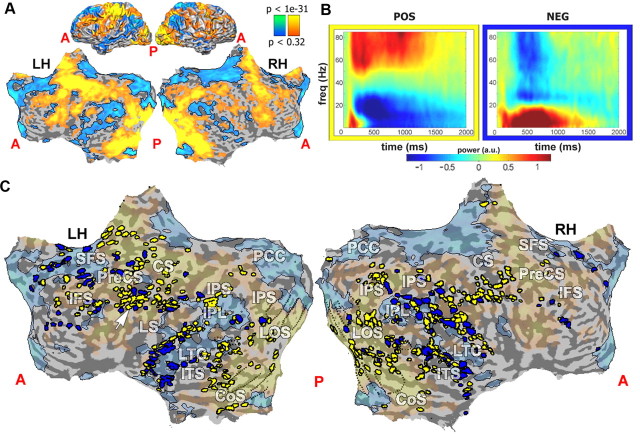
Clustering into positive and negative responses to the BM task across entire cortex. A, Normal and flattened cortical map showing BOLD-activated (yellow) and inactivated (blue) cortical regions in categorization task during fMRI mapping (Goldberg et al., 2006). The map is superimposed on a cortical reconstruction of one healthy subject from a previous study. B, Average induced time–frequency responses (centroids) of clusters arising from two-way clustering of responsive electrodes (based on similarity of time–frequency pattern; see Materials and Methods). The centroids were calculated for the negative and positive clusters (shown surrounded by blue and yellow frames, respectively). Average normalized power is coded by color (see color key). Note the typical positive signature of increased gamma and reduced alpha/beta power, and its inversion in the negative cluster. C, Clustered electrode locations (blue, negative cluster; yellow, positive cluster) superimposed on map shown in A (transparent patches). Dotted lines denote borders of retinotopic visual areas V1, V2, V3, VP, V3A, and V4/V8. White arrow points to motor region electrodes. Note the overlap of negative cluster electrodes with DMN (faint blue regions), but also clear prevalence of negative cluster electrodes in visual (dotted lines) and motor areas (arrow). A, Anterior; P, posterior; LH, left hemisphere; RH, right hemisphere; PreCS, precentral sulcus; CS, central sulcus; IFS, inferior frontal sulcus; SFS, superior frontal sulcus; IPS, inferior parietal sulcus; LOS, lateral occipital sulcus; CoS, collateral sulcus; LTC, lateral temporal cortex; ITS, inferior temporal sulcus.

