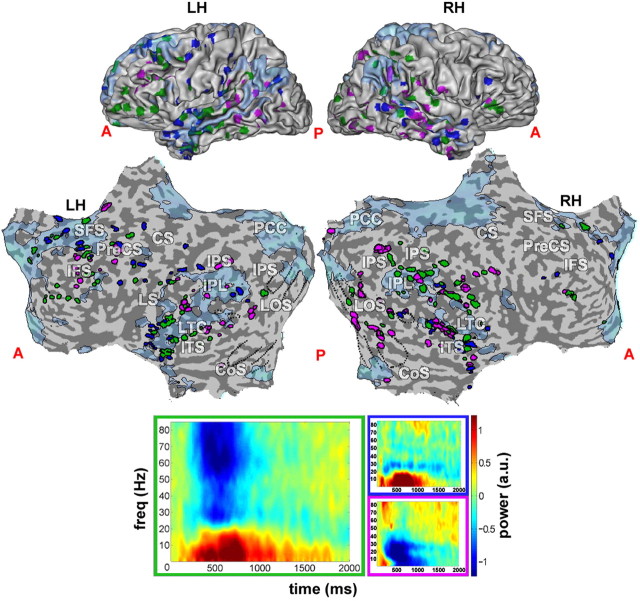
Figure 2.
Negative-cluster and negative-gamma responses across entire cortex. Locations of task-negative responses, revealed through clustering and significant gamma decrease, superimposed on negative BOLD map from Figure 1A (blue). Green, Electrodes that were both negative-cluster and gamma-negative; blue, negative-cluster-only electrodes; purple, gamma-negative-only electrodes. Bottom, Respective set centroids (see Materials and Methods; Fig. 1). A, Anterior; P, posterior; LH, left hemisphere; RH, right hemisphere; PreCS, precentral sulcus; CS, central sulcus; IFS, inferior frontal sulcus; SFS, superior frontal sulcus; IPS, inferior parietal sulcus; LOS, lateral occipital sulcus; CoS, collateral sulcus; LTC, lateral temporal cortex; ITS, inferior temporal sulcus.

