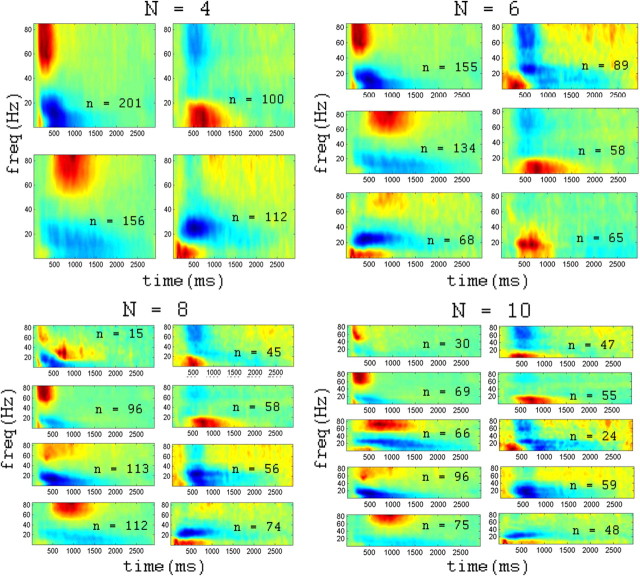
Figure 3.
Effect of changing cluster number. Average induced time–frequency responses (centroids) of clusters arising from four, six, eight, and 10-way clustering of responsive electrodes (based on similarity of time-frequency pattern; see Materials and Methods). The centroids were calculated for each cluster. Average normalized power is coded by color (see color bar in Fig. 1B). Note the division of the clusters into two groups, one with increased gamma and reduced alpha/beta power (left), and one with decreased gamma (right). Clusters are sorted according to latency of gamma increase/decrease. Within each cluster, n indicates the number of electrodes belonging to the cluster.

