
Figure 4.
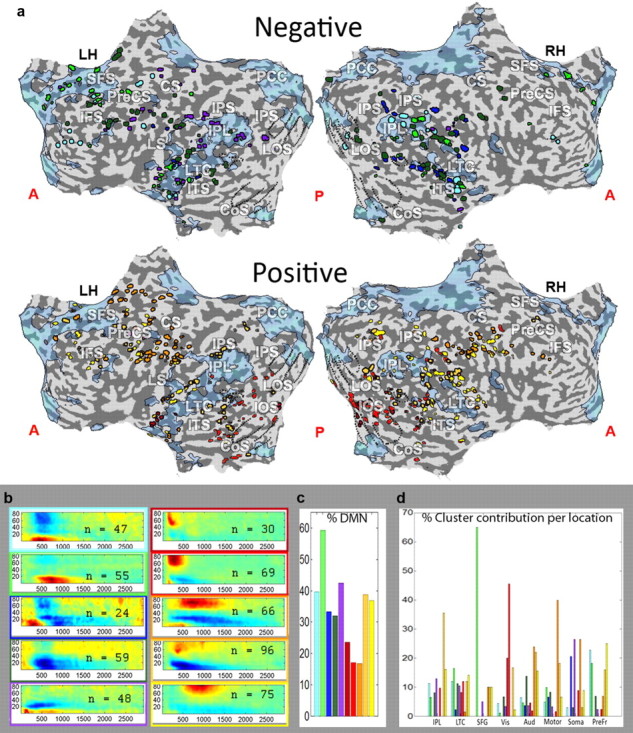
Visualization of 10-way clustering results on the cortex. a, Localization of electrodes belonging to each of the 10 clusters on a flattened cortical map. Electrodes belonging to the clusters with a gamma decrease shown on top (negative) and those belonging to clusters with a gamma increase shown on the bottom (positive) unfolded maps. Clusters are color coded as in Figure 1, with colors corresponding to the frame around the spectrogram of that cluster shown in b. b, Spectrograms of the 10 clusters shown in a, divided into positive and negative groups. c, Percentage of electrodes within each cluster that fall within the DMN. Each bar represents the percentage of DMN electrodes within that cluster. Colors same as a and b. d, A breakdown of the cluster composition of each of the eight anatomical locations according to percentage cluster contribution. Each bar represents the percent contribution of that particular cluster to the anatomically defined group. Colors as in Figure 1. PreCS, precentral sulcus; CS, central sulcus; IFS, inferior frontal sulcus; SFS, superior frontal sulcus; IPS, inferior parietal sulcus; LOS, lateral occipital sulcus; CoS, collateral sulcus; LTC, lateral temporal cortex; ITS, inferior temporal sulcus; Aud, auditory cortex; Soma, somatosensory cortex; Prefr, prefrontal cortex.