
Figure 6.
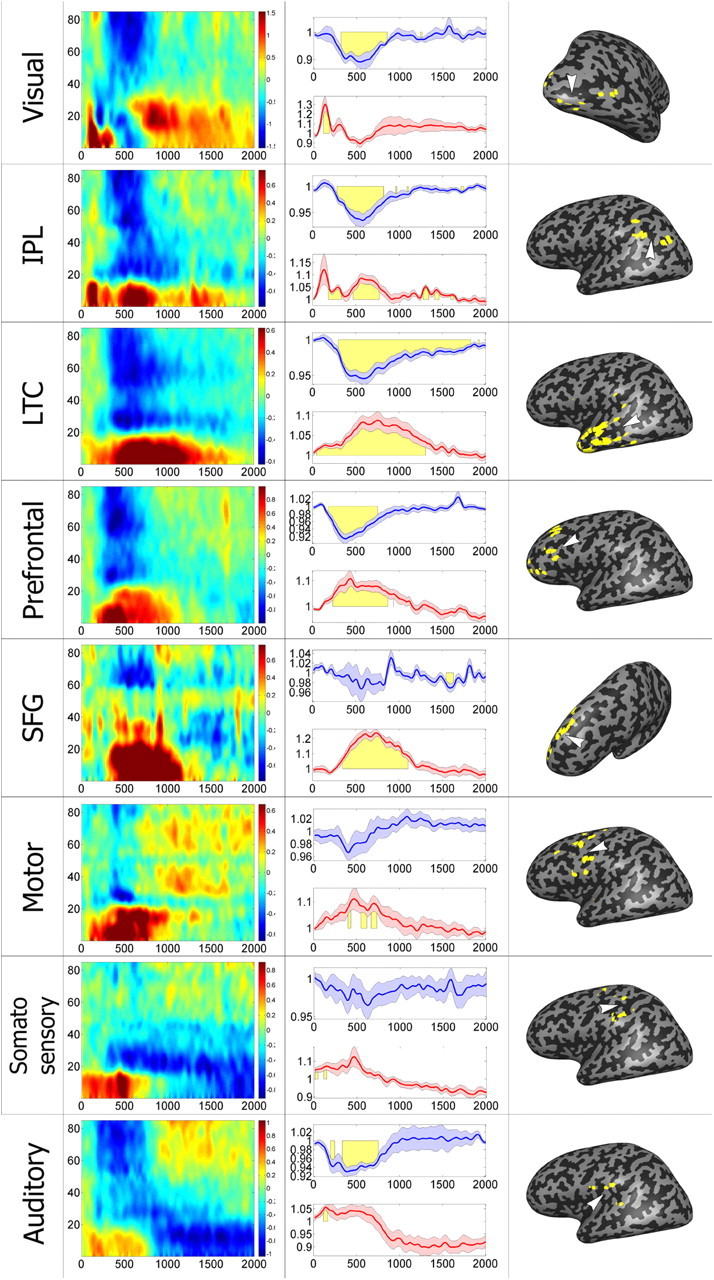
Mean negative cluster response by region. Average responses of all negative-cluster electrodes, divided by anatomical region. Left, Mean time–frequency response of all region electrodes, shown in logarithmic scale (see color key). Middle, Mean ± SEM gamma (30–85 Hz, blue) and alpha (5–15 Hz, red) BLP response across all region electrodes. Yellow denotes time points of significant deviation from baseline BLP levels (see Materials and Methods). Right, Electrode locations, as well as approximate locations of region centers, shown on inflated brain. Each row represents a different region, as defined in Figure 5.