Figure 9.

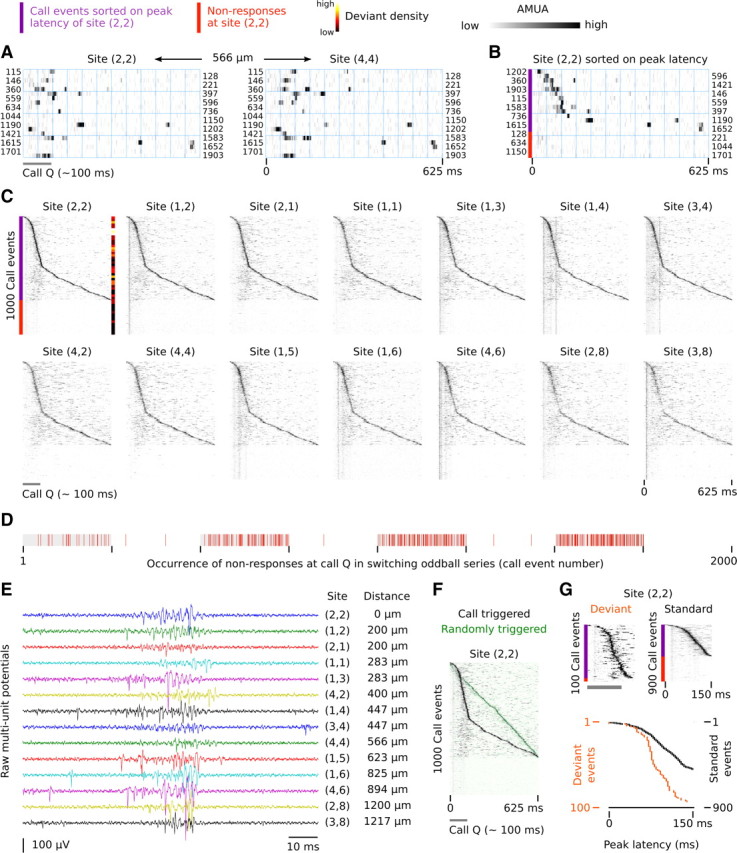
Internal synchrony in response patterns across different secondary auditory sites in NCM. A, Raster plot of activity at two sites during a random 20 (of 1000) call epochs (call Q; bird 10). The numbers at the rows refer to the sequence number of the call event in the switching-oddball series. Activity patterns are similar between the two sites, which are 566 μm apart. B, Same epochs of site (2,2) as in A, but now sorted on the latency of the strongest peak within an epoch. Nonresponses (red bar) are considered to have no latency and are appended after the epoch with the longest latency. C, The raster plot of all 1000 call Q epochs at site (2,2) is sorted on the latency of the strongest peak within an epoch, and the raster plots of the 13 other sites are ordered correspondingly, so that concurrent epochs are aligned vertically with that of (2,2). The peak of activity at (2,2) is matched by synchronous activity at other sites, even though it is not locked to the call stimulus. At a number of sites, response traces can be seen that are synchronized to the call stimulus, but these are faint and presumably originate from nearby primary sites in L2. The local density of deviants in the sorted raster is indicated by a color bar and has been calculated with a histogram using a bin width of call 50 epochs. Site (2,2) has a DPC value of 0.30 for call Q and 0.26 for call R and is thus strongly sensitive to call deviance. D, Nonresponses occur throughout the switching-oddball series and are followed by responses. Note that only nonresponses at call Q are indicated; the other call in the series (call R) is not shown. E, Raw action potential waveforms around one peak at the different sites. The distances indicated are relative to site (2,2). F, The nonlinear shape of the peak activity bursts in the call stimulus-triggered, latency-sorted rasters indicate that the underlying process that generates this activity is linked to call perception. If activity were randomly timed with respect to call occurrence it would show a linear shape. This is illustrated here by superposing a semitransparent version of the call triggered activity raster of site (2,2) in C (in gray tones) on an activity raster of the same activity but then randomly triggered (in green tones; random uniform distribution, for each event between 0 and 625 ms after call occurrence). G, The latency of the peak activity bursts differs depending on whether or not a call stimulus is deviant. Note that the time axis of the two rasters ranges from 0 to 150 ms after call onset for visual purposes but that quantification of peak latency was based on the complete response epoch duration of 625 ms. The bottom plot shows the latency of the peak activity (i.e., maximum AMUA within an epoch) extracted from the top rasters, a procedure that was used to statistically test for differences in latency between standard and deviant conditions across all birds in this study, the outcome of which is highly significant (see Results, Responses of secondary auditory sites are internally synchronized).
