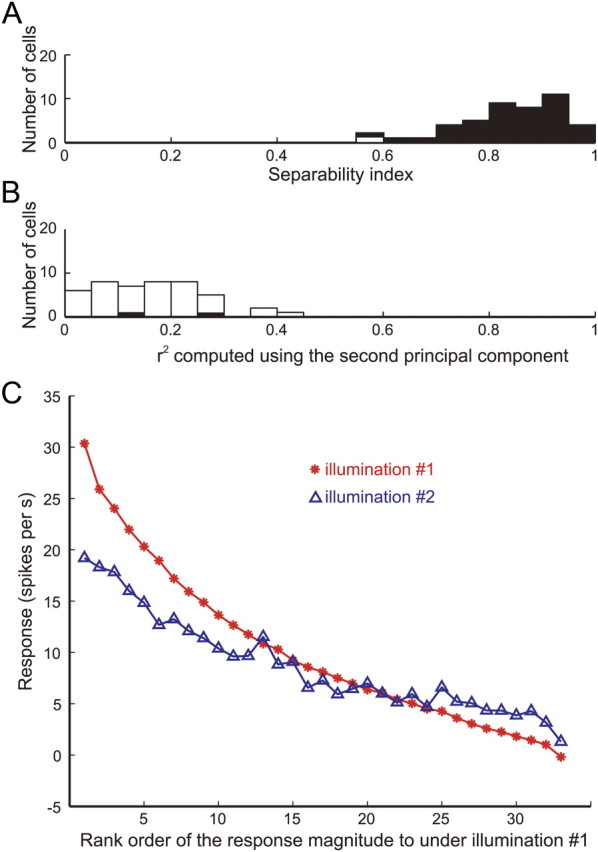
Figure 12.

Effect of illumination on responses among gloss-selective neurons. A, Distribution of separability indices for the change in illumination. The filled and open bars indicate significant and nonsignificant cells, respectively, based on the permutation test. B, Distribution of r2 between the actual and predicted responses computed from only the second principal component. C, Average of the responses of 57 gloss-selective neurons to stimuli with the optimal shape rendered under default illumination (illumination 1, Eucalyptus Grove; red line) and another illumination (illumination 2, Campus at Sunset; blue line) sorted according to the rank order of the responses under illumination 1.
