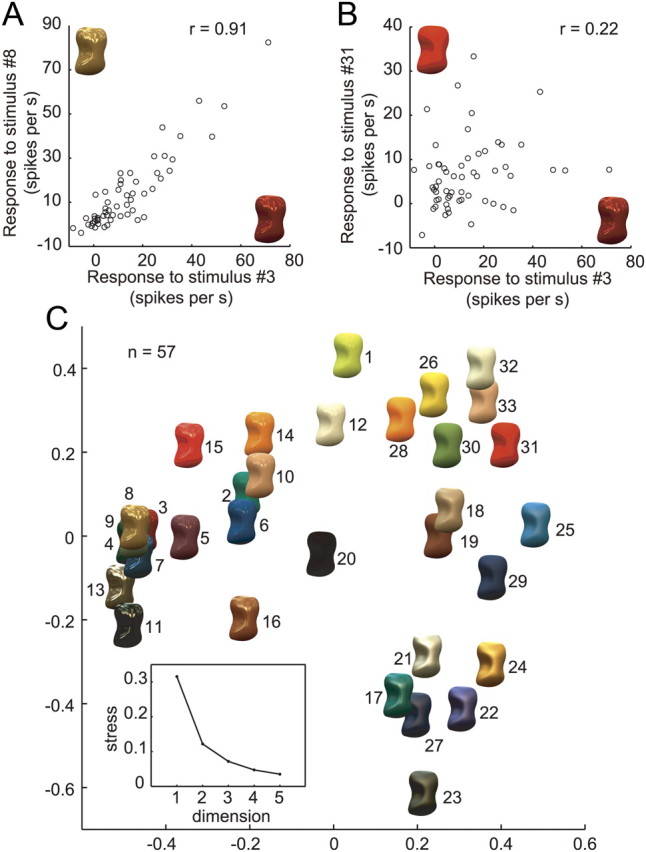
Figure 13.

Neural representation of gloss in the activities of gloss-selective neurons. A, Relationship between the responses of 57 gloss-selective neurons to a pair of stimuli (surfaces 3 and 8) that are similarly glossy in appearance. The horizontal axis indicates responses to one stimulus (no. 3); the vertical axis indicates the responses to the other (no. 8). B, Relationship between the responses of 57 gloss-selective neurons to a pair of stimuli (surfaces 3 and 31) that differ with respect to their glossiness. Conventions are as in A. C, Two-dimensional plot of the results of MDS analysis. Distances were based on 1 − r between the responses of the 57 gloss-selective neurons for each stimulus pair from the gloss stimulus set. The inset is a scree plot showing the relationship between the number of dimensions and the stress in the MDS analysis.
