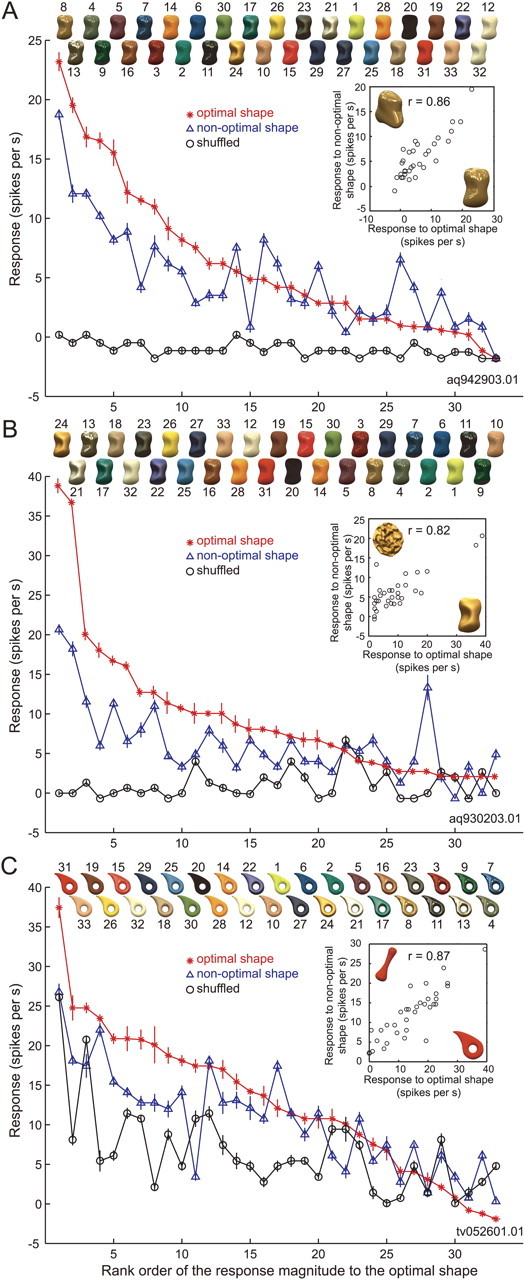
Figure 5.

Effects of a change in object shape and pixel shuffling on the activity of the neurons depicted in Figure 4. A, Responses of cell 1 (the same neuron depicted in Fig. 4A–C) sorted according to the rank order of its response magnitude when the optimal shape was used. The horizontal axis indicates rank order for the optimal shape (shape 3); the vertical axis indicates response magnitude (with SEM). The red line depicts the responses to the optimal shape; the blue line, those to the nonoptimal shape (shape 2); and the black line, those to the shuffled stimuli. Object images with the optimal shape are shown at the top in rank order. The inset shows the relationship between the responses to each stimulus in the gloss stimulus set for the optimal (horizontal axis) and nonoptimal (vertical axis) shapes. B, C, Responses of cells 2 (the same neuron depicted in Fig. 4D,E) and 3 (the same neuron depicted in Fig. 4F,G), respectively. The optimal and nonoptimal shapes were shapes 3 and 9 for cell 2 and shapes 8 and 4 for cell 3. The conventions are as in A.
