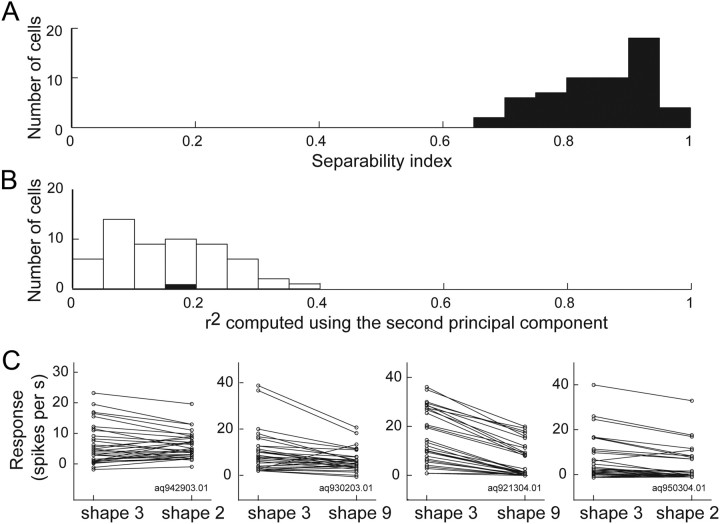
Figure 7.
Separability index for a change in shape. A, Distribution of the separability index for a change in object shape. The horizontal axis indicates the separability index, the vertical axis the number of cells. B, Distribution of r2 between the actual and predicted responses computed from only the second principal component. The filled and open bars indicate significant and nonsignificant cells, respectively, based on the permutation test. C, Raw interaction plot connecting the responses to the gloss stimulus set for the optimal shape (left) and the nonoptimal shape (right) for four representative example neurons. The left two panels are for cell 1 and cell 2 depicted in Figures 4 and 5. Separability index for each neuron is 0.92, 0.93, 0.96, and 0.98, respectively.

