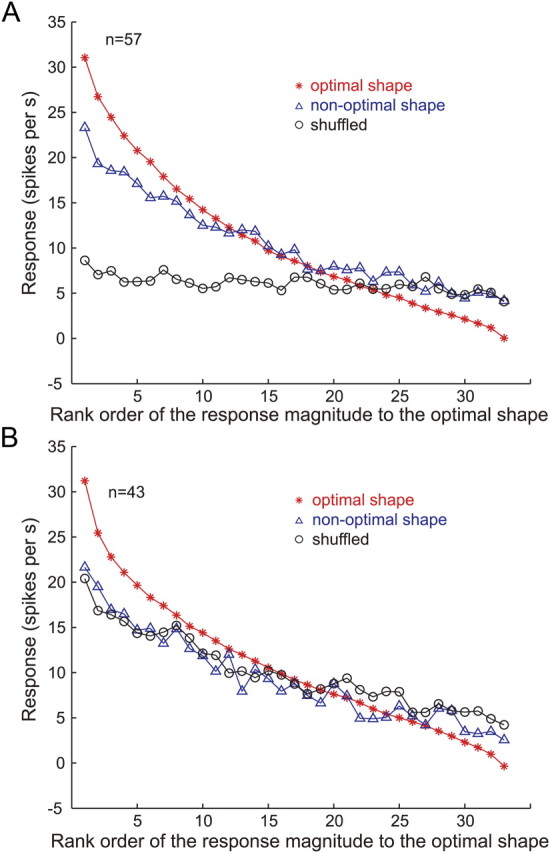
Figure 9.

Rank order of the responses to the gloss stimulus set: population average. A, Average of the responses of 57 gloss-selective neurons (Fig. 6, red circles) to stimuli with the optimal shape (red line), a nonoptimal shape (blue line), and shuffled stimuli (black line), sorted according to the rank order of the responses to the optimal shape for each neuron. B, Average of the responses of 43 neurons that showed significant correlation between the responses to the optimal shape and shuffled stimuli (Fig. 6, blue circles). Other conventions are the same as in A.
