
Figure 6.
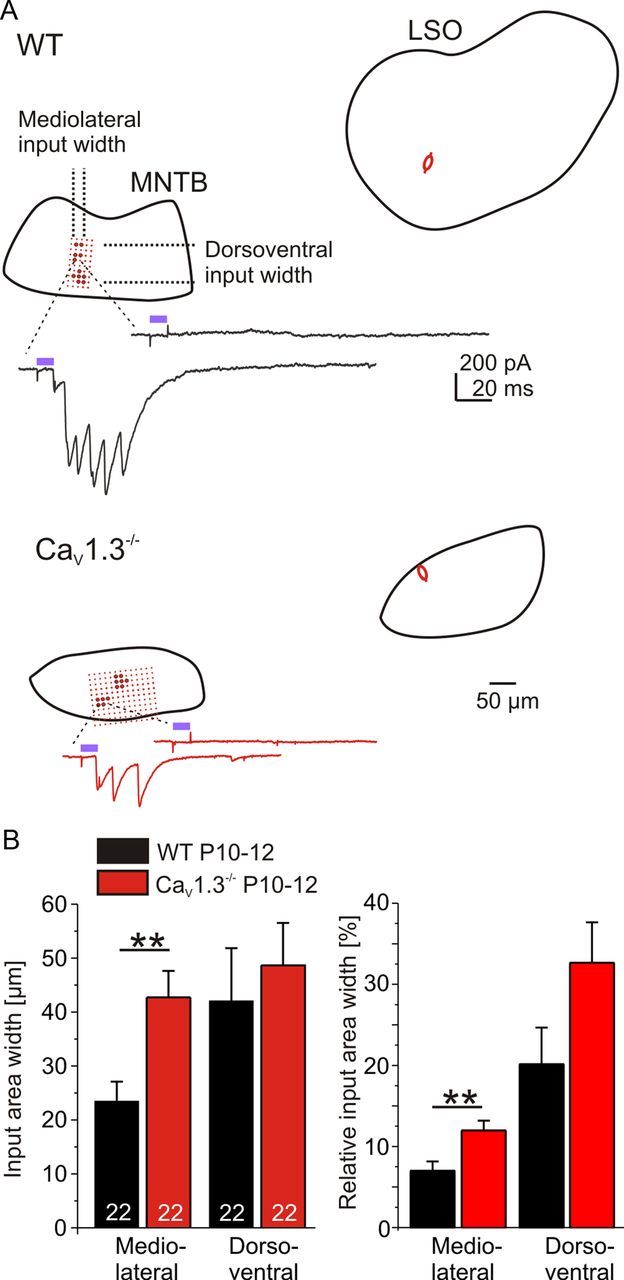
Broader synaptic input width to LSO neurons in CaV1.3−/− at P10–P12. A, Exemplary results from mapping experiments in WT and CaV1.3−/−. Spots in the MNTB mark the uncaging sites in the focal raster protocol. The focal raster had been initially determined by scanning the complete MNTB using a coarse raster. Big spots in the MNTB mark positions at which photolysis of MNI-caged glutamate led to IPSCs in the patch-clamped LSO neuron, whose position is depicted by a schematic cell. For each genotype, current traces of a successful and an unsuccessful stimulation are shown exemplarily. Violet bars in example traces depict laser pulse duration. B, Statistical analysis. A Comparison between WT and CaV1.3−/− is shown. Relative input area width depicts values normalized to the MNTB extent. **p < 0.01.