
Figure 1.
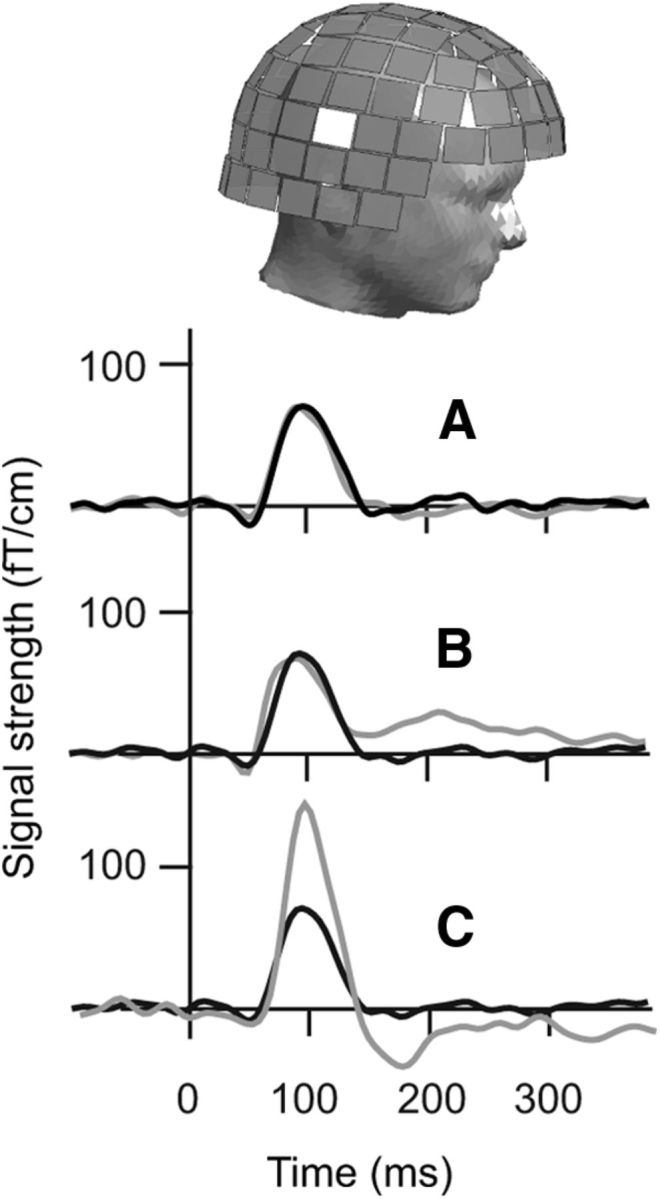
MEG signals. Responses at the sensor that displayed the maximum signal strength over the right hemisphere, when the auditory stimulus was given to the left ear. A, Subject S1: signals from two recordings separated by 20 min, overlaid (black and gray). B, The response of subject S1 (black) at ∼100 ms after stimulus onset (time 0) and the corresponding response of her sibling (gray) are remarkably similar. C, Marked differences are apparent between the responses of subject S1 (black) and an unrelated subject (gray).