
Figure 3.
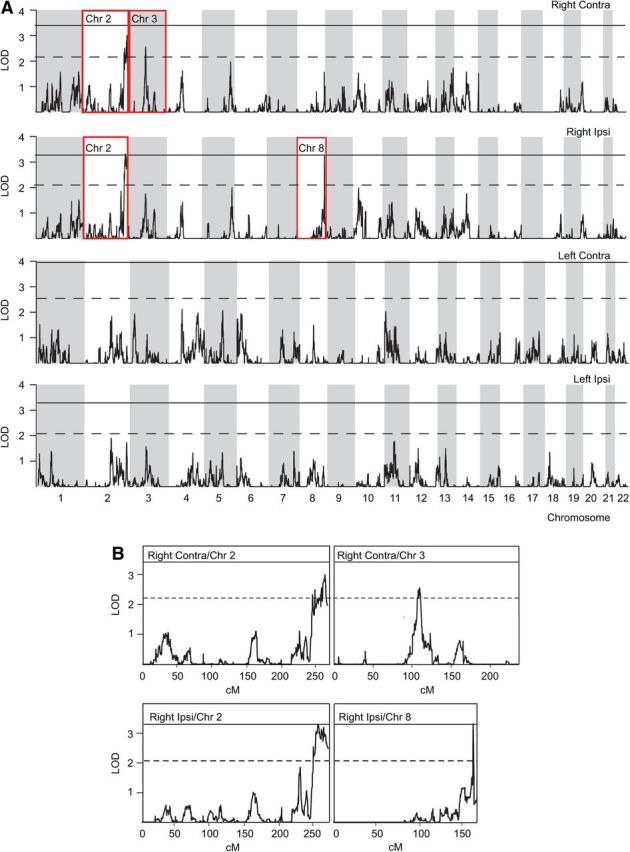
Linkage analysis. A, LOD scores of variance component-based linkage analysis between the four amplitude-value phenotypes and ∼150,000 autosomal SNPs, plotted against genomic location in centimorgan units. The threshold LOD scores for significant and suggestive results are indicated by continuous and dashed lines, respectively. The white and gray shading denotes even- and odd-numbered chromosomes. B, The insets provide an enlarged view of the chromosomes with significant or suggestive linkage, highlighted with red rectangles in A.