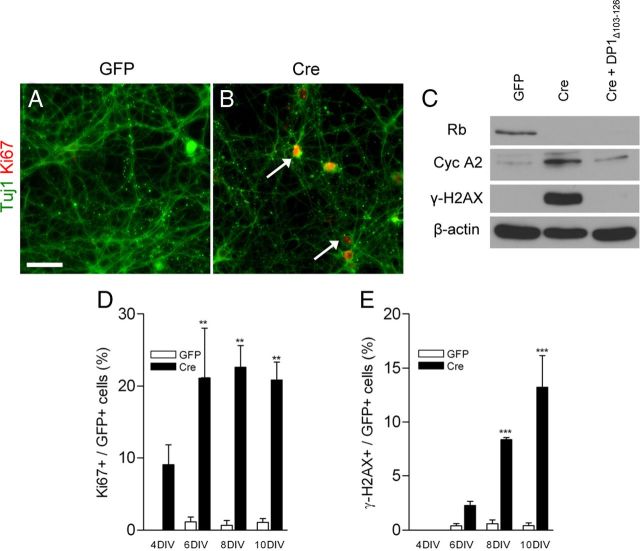
Figure 3.
Rb-deficient neurons display cell cycle and DNA damage markers. A, B, Cortical neurons were fixed at 8 DIV and stained for Ki67. C, Western blots were performed on total protein extracted at 8 DIV. D, E, Cortical neurons were fixed at the indicated DIV and quantified for the percentage of double labeling (Ki67+/GFP+ over GFP+, γ-H2AX/GFP+ over GFP+) (n = 3 or 4). **p < 0.01,***p < 0.001. Scale bar, 50 μm. Error bars indicate SEM.

