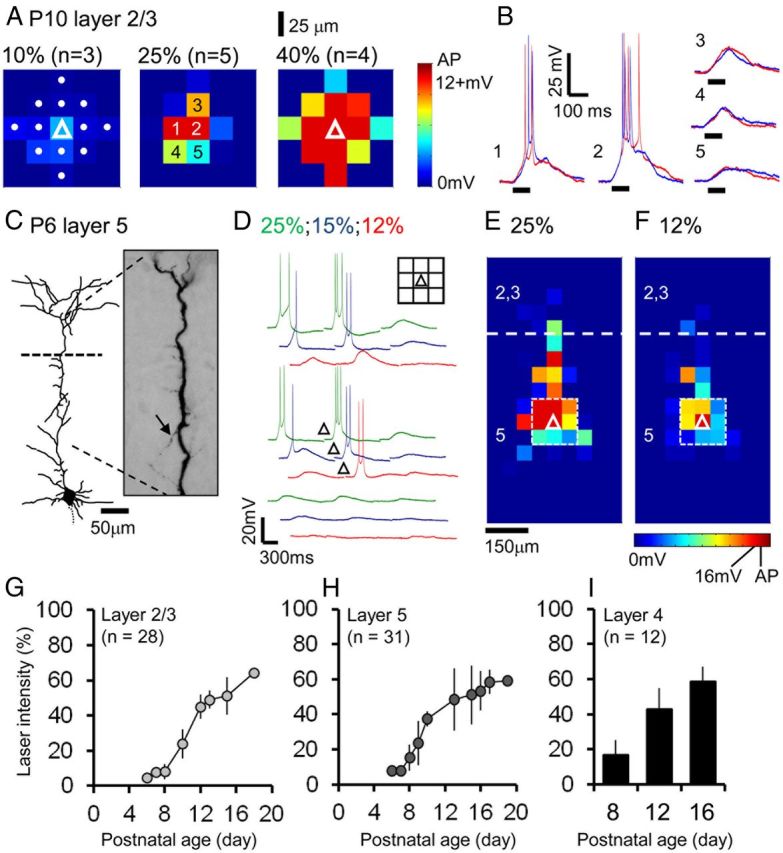
Figure 1.

Adjustment and calibration of laser intensity according to postnatal developmental time point. A, To establish the approximate area excited by LSPS-evoked glutamate uncaging, the UV laser (355 nm; 100 ms duration) was repeatedly fired at a range of intensities (from left to right: 10%, 25%, 40% of maximal laser power at the slice interface) in the immediate vicinity of the recorded P10 pyramidal cell (white triangle, left panel) at target points spaced at a distance of 25 μm (white dots, left panel). Action potentials (red squares) were consistently evoked at two or more spots at higher intensities. Raw current-clamp traces from the numbered laser target points at 25% laser power (middle panel) are shown in B. B, Superimposed traces from two repeats (red and blue traces) at 25% laser power. Direct responses matched the duration (100 ms) of the laser pulse (bold black line under the traces). C, Reconstructed morphology of a P6, layer 5 pyramidal cell. At early ages the relatively simple dendritic arbors with numerous small neurites (arrow) required careful adjustment of the laser intensity. D, Direct stimulation profiles of the cell (C) at a range of laser powers; only spots in the immediate vicinity of the recorded cell are shown for clarity; full averaged response maps are shown in E and F. Inset, Diagram of the 150 × 150 μm grid with the location of the cell soma target spot indicated by the triangle. E, F, Complete direct stimulation maps of the cell shown in C and D at 25 and 12% laser power, respectively. Calibration of the laser intensity ensured that action potentials (red squares) were only elicited when the laser was fired directly at the cell soma (indicated by the white triangles) during the columnar LSPS mapping (50 μm spaced grid). The laser spots enclosed by the white dashed box correspond to those points shown in D; the layer 2/3 to 5 boundary (white dashed line) is approximated to the nearest 50 μm. Calibration of the laser intensity required to evoke action potentials at the cell soma revealed increased power for layer 2/3 (G), layer 5 (H), and a smaller sample of layer 4 (I) pyramidal cells over the developmental period studied; all values ±SEM.
