
Figure 9.
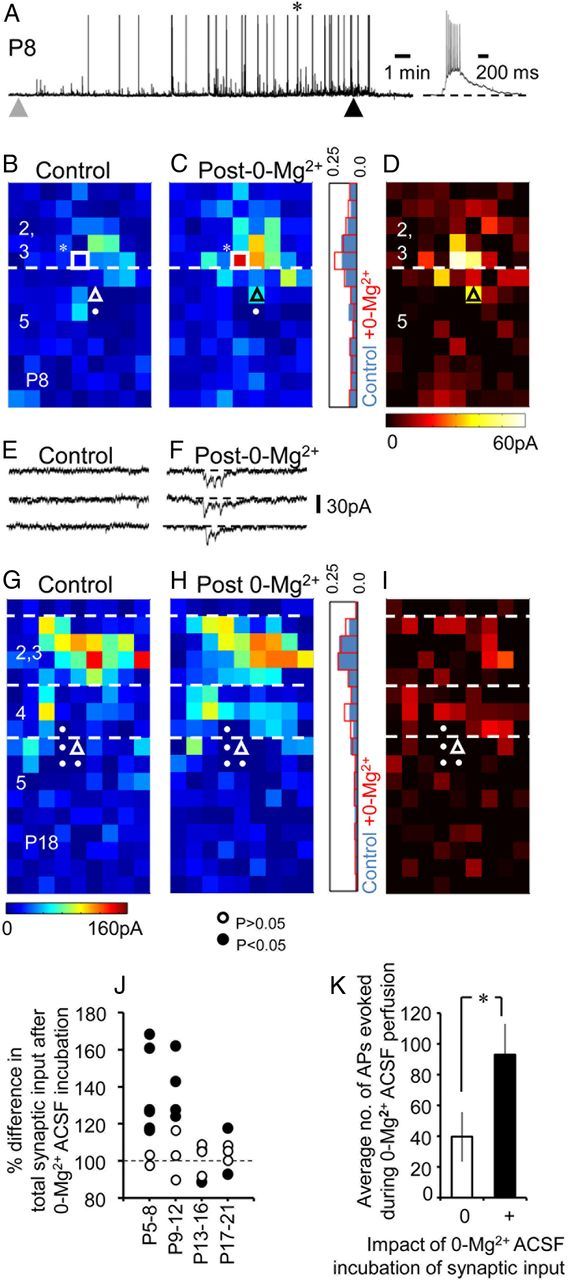
Activity-dependent enhancement of synaptic input onto early (≤P12) postnatal pyramidal cells. A, Impact of 20 min 0-Mg2+ ACSF incubation on sub- and suprathreshold activity levels in a P8 pyramidal cell; gray and black arrowheads, onset and end of 0-Mg2+ ACSF perfusion, respectively. Inset, A burst of action potentials marked with an asterisk in the main trace shown on an expanded time scale. B, C, Average synaptic input maps onto a P8, layer 5 motor cortex pyramidal cell under baseline conditions (Control; B) and after recovery from 20 min incubation in 0-Mg2+ ACSF (Post-0-Mg2+; C). The histogram adjacent to C indicates the normalized sum of inputs across the vertical axis for the control (blue) and post-activity (red line) maps. The white square and asterisk indicates the laser target spot from which 3 repeat voltage-clamp traces are shown below the maps for each condition (E, F). D, Plot showing laser target points that showed an increase in synaptic input following 0-Mg2+ ACSF perfusion. G–I, Data presented in a manner similar to the cell shown in B–D but for a P17, layer 5 somatosensory pyramidal cell. J, A plot showing the impact of 20 min incubation with 0-Mg2+ ACSF on the total synaptic input onto pyramidal cells plotted over the development time window examined. Black circles indicate a significant (two-tailed Wilcoxon signed-rank test; p < 0.05) difference in total synaptic input between control and post-0-Mg2+ maps. K, Histogram showing the average number of action potentials (APs) recorded during the 20 min 0-Mg2+ ACSF perfusion for all the P5–P12 pyramidal cells that showed no (white bar) or alternatively a significant change (p < 0.05) in total synaptic input.