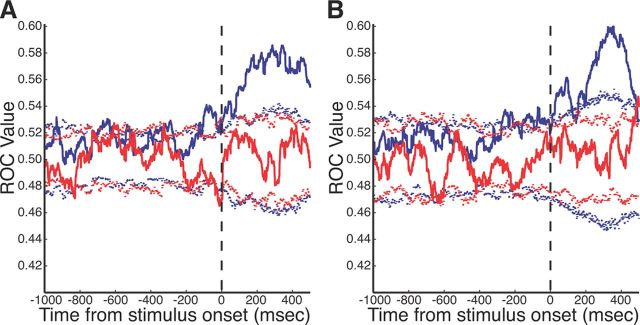
Figure 11.
ROC curve of task selectivity before and after ketamine administration. A, ROC values for rule-visible trials. Preinjection (blue solid line) and postinjection (red solid line) task selectivity ROC values with accompanying 2.5 and 97.5% (dashed lines) significance cutoff values as calculated by bootstrap analysis. B, ROC values for rule-memorized trials (same format as A).

