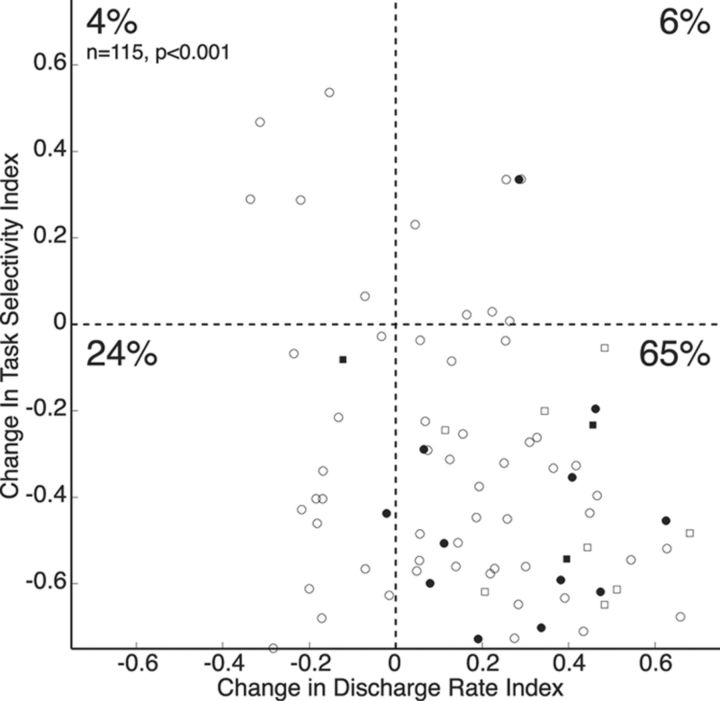
Figure 5.
Effect of ketamine on change in discharge rate and change in task selectivity. Scatter plot depicts the change in discharge rates of neurons (interval from 1000 ms before to 500 ms after stimulus onset) after ketamine injection on the x-axis and the change in task selectivity (same analysis interval as x-axis) on the y-axis. The circles indicate neurons recorded from monkey O, the squares indicate neurons recorded from monkey W, filled represent narrow-spiking neurons, and hollow points represent broad-spiking neurons.

