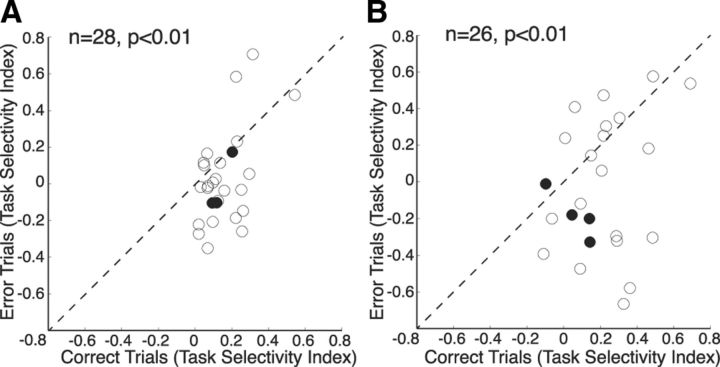
Figure 9.
Changes in task selectivity for error trials and correct trials. Change in task selectivity of neurons during trials completed correctly after ketamine administration is plotted on the x-axis, while change in task selectivity of neurons during error trials is plotted on the y-axis. A, Differences of correct trials versus error trials during the prestimulus epoch. Data points below the unity line (dashed line) indicate a greater loss in task selectivity during error trials. B, Differences of correct trials versus error trials during the stimulus/response epoch (same format as A). The solid points in both plots represent narrow-spiking neurons; the hollow points represent broad-spiking neurons.

