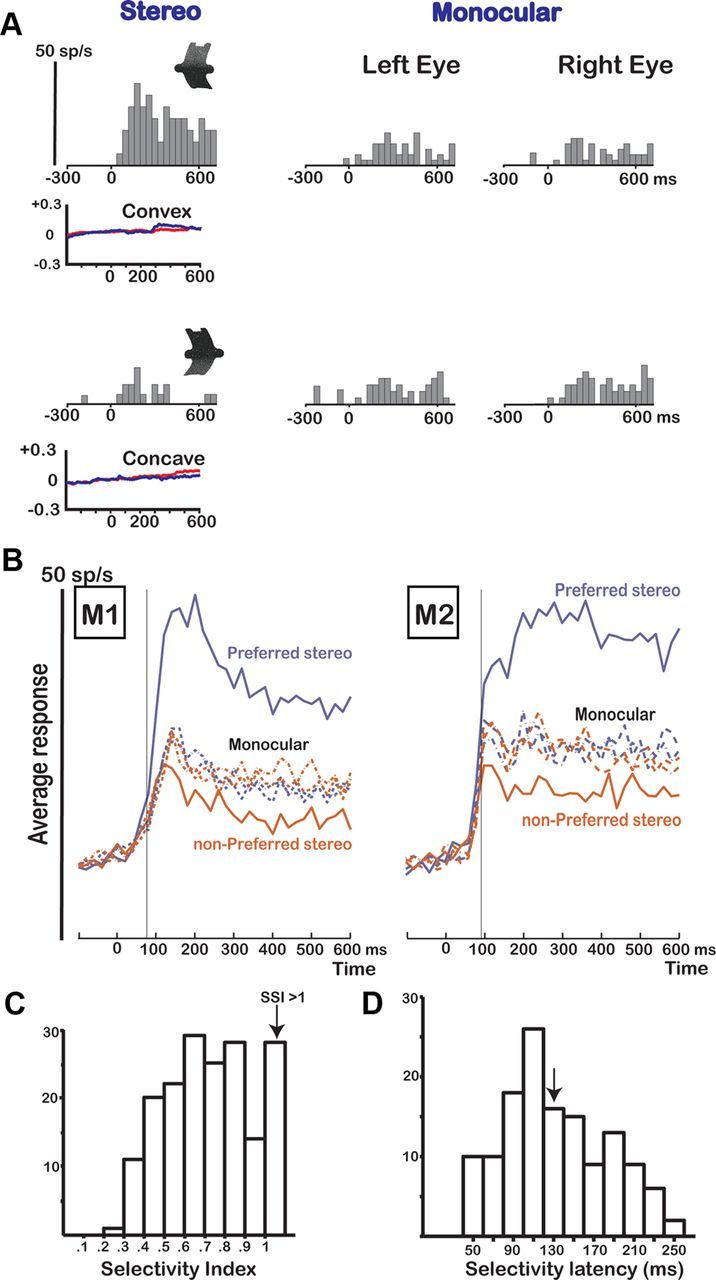
Figure 3.

Disparity test. A, Responses of an example neuron in area F5a showing selectivity in the disparity test. The icons illustrate the depth profile of the stimuli: convex (top row) and concave (bottom row). The neuron was tested with 3D shapes (stereo) and monocular presentations of the same stimuli (monocular left eye and right eye). The vertical calibration bar indicates 50 spikes per second (bin width, 40 ms). Average horizontal eye position traces during presentation of the convex and concave shapes are plotted below the PSTHs for the left (red) and right (blue) eyes. B, Population response of all disparity-selective neurons (N = 178) in M1 (N = 98) and M2 (N = 80). The average responses to the preferred (blue) and the nonpreferred 3D shapes (red) are plotted as a function of time after stimulus onset (0). The thin vertical line indicates the latency of selectivity of the population response. The dashed lines represent the responses to the corresponding monocular stimuli. C, Histogram of SSI for all disparity-selective F5a neurons (N = 178). The last bar includes all cells that had an SSI of 1 or higher. D, Histogram of the selectivity latencies for all disparity-selective F5a neurons. The arrow indicates the median selectivity latency (130 ms).
