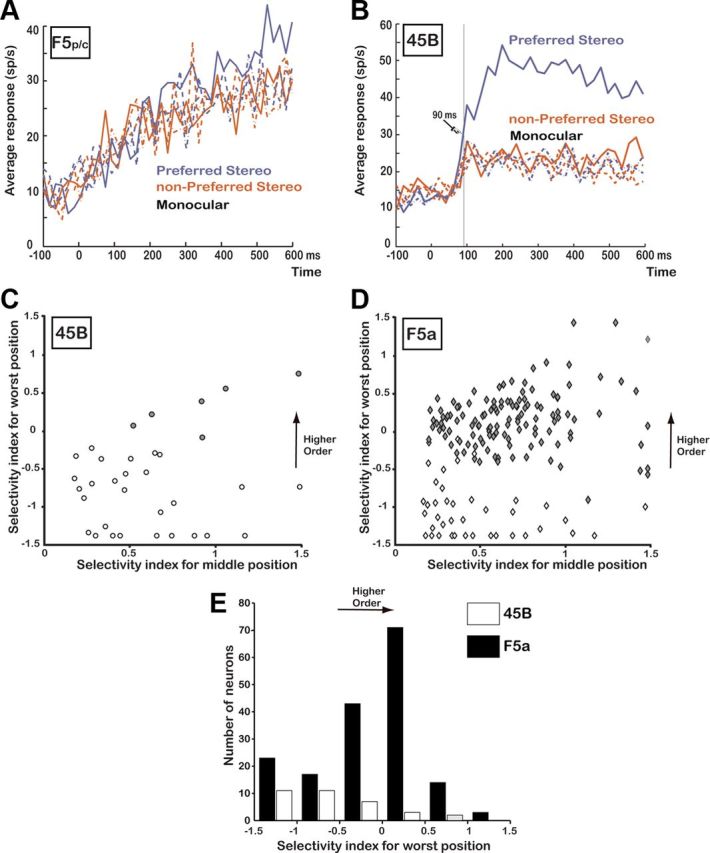
Figure 5.

Responses in other periarcuate regions. A, Average response of all responsive neurons recorded in F5p/c (N = 20; same conventions as in Figure 3C). B, Average response of all disparity-selective neurons recorded in area 45B (N = 34; same conventions as in Figure 3C). C, Selectivity index at the middle position plotted against the selectivity index at the worst position (i.e., the smallest response to the preferred 3D shape compared to the strongest response to the nonpreferred 3D shape) for all disparity-selective neurons in area 45B (N = 34). Open symbols, Zero-order neurons; filled symbols, higher-order neurons. D, The same selectivity indices plotted for all disparity-selective neurons recorded in F5a (N = 171). E, Histogram of the selectivity index at the worst position for all disparity-selective neurons recorded in F5a (N = 171; filled bars) and area 45B (N = 34; open bars).
