
Figure 2.
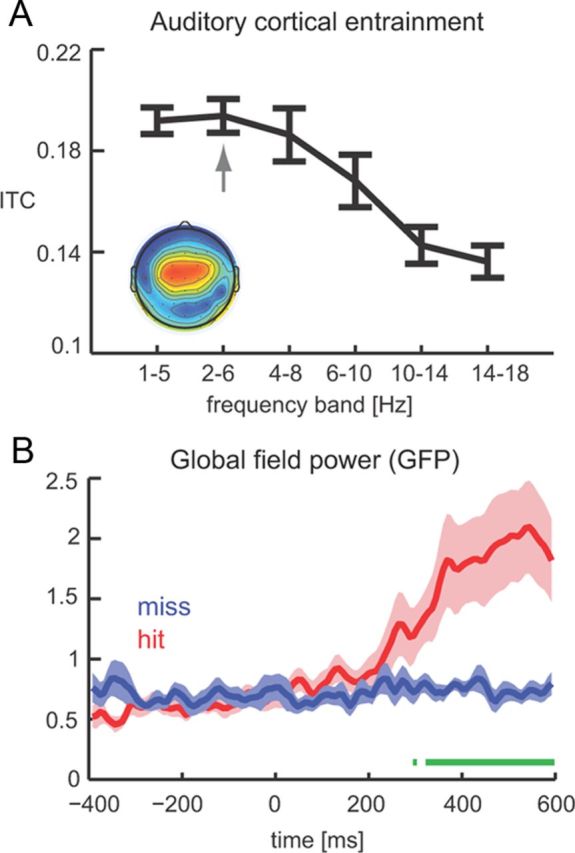
The state of cortical oscillations during sensory stimulation. A, Phase coherence as a function of frequency band demonstrating that peak entrainment occurs in the 2–6 Hz band. We used data from a previous study (Ng et al., 2012) because the prolonged stimulation allows for a more accurate estimation of phase entrainment. B, GFP for hit (red) and miss (blue) trials reveals no state change from pre-target to post-target epochs during miss trials. Time 0 corresponds to target onset, and green bars delineate epochs with a significant difference between hit and miss trials (paired t test, p < 0.01).